資本論の読む際のメモ書き by Ryo
This post was actually made on 10/11/2025. I'll be keep adding notes here. メモ書き(2) (1) 媒介された共同性<集合態における物象化の必然性> (2) 媒介の階級的な収奪<非人格的支配> (3) 媒介の技術合理化<ファウスト的な合理化の話, 合理化の進行=惰性化> (4) 物象化の重層的完成<資本-賃労働関係としての資本家を単位とした集合態つまり総体> このような"資本論"の重層的な論理構成は、現代社会の社会的な諸形象の存立構造の、総体的・具体的な把握をめざすわれわれの企図にとっても、高度に示唆的である...社会的諸形象の存立の論理というものが、経済的領域においてのみならず、これらの政治的・イデオロギー的な領域においても、同様に貫徹していることをわれわれに示す - p66, 存立構造 [1]/[2] (1) 媒介された共同性 <商品の性格に由来する>この価値法則は、このような彼ら<資本家的生産者・商品としての労働者も?>の相互の加え合う競争の圧力を媒介として、"ただ内的な法則として、個々の当事者にたいしては盲目的な自然法則として作用する" - p55, 存立構造 このみずからに外化された共同的本質を、彼らは自己に外在し拘束する客観的な原理として体験するが、そのさい彼らは、この"客観的"原理にたいする"主観的"自己適合として、それぞれの存在位置に応じた社会的性格を発達させる - p72, 存立構造 [3] (2) 媒介の階級的な収奪 労働力の商品化という、商品関係をその存立構造の基礎としている...資本と賃労働との垂直的な、階級的な支配関係...資本物神<非人格的支配>の存立機構...は論理的にも歴史的にも、商品関係の発展を前提とすることなしには存立しえない - p55, 存立構造 この新しい関係の水準においては、"資本は本質的に資本を生産する"というように、自己増殖する価値として、社会的生産関係の対象化的な主体化、すなわち物神化は自乗される - p56, 存立構造 (3) 媒介の技術合理化 通時・共時的協働連関の媒介をなす生産手段と労働組織そのもののうちに合理化が貫徹することによって、それぞれが機械および工場としての圧倒的な物的定在性を獲得し、これらによる直接的な労働の支配という現象のうちに、階級関係の人格性は完全に抽象され、即物化される。媒介のこの合理化と機械化は、資本制社会においては"資本の生産力の不断の増大として現れる"ように、現実には垂直性の階級関係を補強し完成する契機として定在する - p57, 存立構造 [4] ルカーチは物象化の前提として、"合理的な機械化と、計算可能性の原理とが、生活の現象形態をとらえねばならない"ということを強調している - p57, 存立構造 [5]/[6] (4) 物象化の重層的完成 第2、第3水準における階級関係の支配者的相互が、ここでふたたび、相互に集列関係に入る...階級関係の論理の中に、集列関係の論理が包摂されることによって、階級関係がみずからの物象化的な姿態を完成する - p61, 存立構造 資本制世界はここに、その総体としての物象化された姿態を完成する...これら、政治的・イデオロギー的な諸形態への言及は、これを一切省いても論理の文脈そのものは失われない - p65, 存立構造 I'll try this version. His translation should be promising haha. 物質性の<自然>の胎内から、一個の不遜な自己目的性としての人間=精神が析出し、残余の<自然>を対象化する主体として立するときにはじめて、人間としての人間の歴史ははじまり...人間と対象的な自然とのあいだを媒介する用具の発展は...対象的な自然を単に受動的な素材たらしめその固有性を解体し加工しつくすことをとおして、次第に労働の過程における直接=享受的な交感の次元を疎外する - p91, 存立構造 [13] [14] <譲渡をとおしての領有>という、社会性の次元において媒介された構造を獲得することによって、外囲の社会を距離化し対象化する主体として...対社会存在(媒介された社会内存在)へ自己形成する。このばあいの方法として重要なことは、この媒介の形態こそが、現実にある諸関係をそれぞれの水準において種差的に特徴づける、本質規定をなすことである...いいかえれば、本源的な実態をつねに潜勢的な主題として保持しつづけながら、その次第に重層化する媒介の諸形態ををこそ、顕勢的な主題として追求し、上向するという、立体的な問題意識=方法意識をとおしてはじめて現実の重層化された存立の構造は獲得しうる - p84, 存立構造 労働し欲求する諸個人が、固有の意味<集列的関係における>での他者と出会うのは、流通の過程<譲渡をとおしての領有>においてのみである。そしてこの流通の過程こそが、諸個人の集列的な関連そのものとしての「市民社会」の、直接的な定在であり、経済形態の次元における唯一の公的な領域である - p96, 存立構造 [8], [9] [15] - 流通過程の要請する生産物の性格規定(交換価値)を、遡って生産過程の規定的な目的性とする。すなわち、欲求し労働する諸個人の、媒介する交換過程への従属ということは、本源的な労働過程自体に逆行して浸透し、この労働の規定的性格そのものを変質してしまう。労働の規定的目的性は、本源的な諸欲求への対応としての価値(使用価値)ではなく、物神化されたこの交換過程(Practical Econ!)の要請に対応する媒介された価値(交換価値)となる - p99, 存立構造 - 労働がその本源的な意味を喪失することは、自己労働なき領域としての収奪への動因の一つを形成すると同時に、他方労働の一定種類への無関心として、労働力そのものの商品化への主体的な前提をも用意する - p100, 存立構造 レヴィ=ストロースは「労働の表象」のなかでおおむね次のようなことを述べている - ユダヤ=キリスト教的労働観(罰としての労働)と資本主義や商業体制下での量としての、商品としての労働とが西欧人の労働観を決定しているのであるが、これはきわめて特殊な労働観である - p170, 仕事 [16] この<他者性の>回路は市場性の相貌のもとにあらわれる客観的な諸連関のうち、諸個人がまさしく疎遠な対象として措定する社会の手中に、握られている...この社会性による媒介された被規定性こそは、狭義の経済学的な諸カテゴリーの存立する地平を用意する - p103, 存立構造 [7] 共同体的な回路の転回 - 共同体社会的所有の転回、共同体的な<外化を通しての内化>の回路がいかに変質するかについて(共同体の自己"転回"の論理 - p138) その始原においては、共同の自己享受<共同体的な<外化を通しての内化>の回路>であったかもしれぬ...それはまさしく共同体的な内化の回路であるがゆえにこそ、みずからの反対物<諸個人>への、疎外への転回にむかって無防備にひらかれている。本源的共同体内部におけるこれらの諸個人の析出は、そのはるかな論理的始原において...異常にもしくは秀でた身体的、精神的資質、あるいはいっそう偶然的な諸因子であったはずである - p136, 存立構造 [10] 社会内過程としての疎外の最も単純な歴史的にも論理的にも原初的な形態は、人格的に相対する諸個人相互の、一方が<内化なき外化>の主体、他方が<外化なき内化>の主体であるような<疎外<->収奪>の関係である...一方は純粋な<労働>の主体、他方は純粋な<欲求>の主体として双対する(ヘーゲルの主と奴の関係) - p117, 存立構造 システムの自己維持的な再生産のメカニズムそのものが逆に、このシステムの解体と自己変質のメカニズムに転回すること。これは論理的必然性ではなくて事実必然性だけれども、これを必然たらしめる基礎的な事実性としての、共同体の対他存在、すなわちその他在としての、自然ならびに他の共同体との拮抗する関係性 - p134, 存立構造 商品世界の存立構造 - 市民社会<集合態>に生きる諸個人の関係の原基形態としての商品交換の関係 現実の市民社会における、すなわち商品交換の関係<交換価値>における人格と人格の関係は、このよう<ミル評注>ではない...すなわち彼自身の意思するとことは、純粋の欲求主体としての自己<主>に、純粋に労働主体としての他者<奴>を関係せしめることにすぎない。このような欲求主体と労働主体の関係とは、まさに前述のヘーゲルにおける<主と奴>の関係に他ならない。すなわちこの関係行為のうちに、潜勢する規定的目的性は、他者の収奪に他ならない...[ミル評注の引用箇所の世界とちがって、彼としては不本意ながら]みずからの労働によって他者の欲求を充足することを、必要に強制される。彼はみずからを<主>とするためにみずからを<奴>とする。収奪するためにみずからを疎外する この市民社会における交通的分業の連関が、どの諸個人にとっても疎遠な対象的な力として存立するのは、ー いいかえればすべての個人が自己の共働的本質を、物象<貨幣>の力としての(物象に媒介されてのみ存立している)物神性<無数の他者たち、不可視の巨大な協働的分業のシステム>として自分から疎外するのは、彼らが相互に疎外し収奪しあう者として、普遍的に対峙しあっているからである。<疎外<->物神化>の関係は、単純な直接的な(諸個人間における)<疎外<->収奪>関係の普遍的な止揚として存立する。市民革命は、前近代的な支配関係の、不変的な止揚に他ならない - p157, 存立構造 この(単純な直接的な(諸個人間における)<疎外<->収奪>)関係を事後的にみると、たとえば共同態内の分業関係における交換と異なることなき、たんに自明の、没問題的な「交換」一般がみえるだけである。この関係を、はじめから事物化された関係態として外観するのではなく、いったんはそれぞれの側から関係行為する当時主体に内在することを媒介するときにはじめて、それは一つの矛盾として、対立するものの統合として把握される - p147, 存立構造 共同態内の分業関係における交換 vs 商品交換の関係<交換価値> における人格と人格の関係🤔 市民社会的回路の転回、収奪(垂直)の関係への転回・転回後の資本の物象化 個々の私的所有者は、その現実的条件さえあれば、いつでも一方的な収奪者に転身することにやぶさかではない...この転回のための現実的条件は、自己の労働力能の販売<労働力の商品化>以外に生活の方途をもたない、階級としての労働者の存在である。このような労働者階級の始源的な創出の過程が、"農村民からの土地の収奪"を中心として、労働主体ををその労働の客観的諸条件から剥離する、"本源的蓄積に先行する諸過程"であることはいうまでもない。しかしこのような関係がいったん始原的に形成されると、資本関係はみずからこの前提自体を再生産する - p163 それは現実に人間たちが、資本の要請するような労働力としてみずからを定在せしめないかぎり、その存在の現実的な諸条件を失うという客観的な構造の転倒性としてある...資本の増殖欲求にとって、人間が過剰であるということ...ここで意味づける主体は資本の側にあり、人間は意味づけられる客体として存立する...この物象としての資本を、みずからの存在の意味を規定する主体として物神化する - p165, 存立構造 事実発達した資本主義諸国の人間は、幾世代もその幼児のうちから、このような労働に耐えかつ適合するような"人材"として陶治され成形される。これら諸国の資本家がその外部の世界に、工場を建設し現地労働者を就業せしめようとすると、その自明のこととして期待する基礎的な陶治そのものさえも彼らがあまりに欠如していることに当惑させられる...資本の諸要請に適合するという人間たちの資質は、たしかに"民族的資質"として存在するかもしれないけれども、このような"民族的資質"自体が、民族それ自体と同様、歴史的形成物である。かの進出資本における現地監督者たちの当惑は、彼らの故国ですでに自明化し、その近代市民社会の存立の内的な要件にまでなっているこれらの人間性そのもの、歴史的な性格を逆照射しているにすぎない - p165, 存立構造 [11] 資本性体制の初期においては、共時的協働の力の領有がその収奪の主要な形態をなしていた。けれども資本制的な収奪を固有に特徴づけるのは、その本格的な段階における収奪の主要な形態をなしている、通時的協働の力の領有に他ならない - p170, 存立構造 資本制社会の存立構造、資本によって内化された主体・要請された"人間性" 機械装置それ自体の総過程のあいだに分散され、包摂され、体系のたんなる一分肢となり、そしてこの体系の統一性は、生きた労働者のうちにではなく、機械装置のうちに実在する<対象化された労働>は...しかし同時に、それはあくまでも労働であり、主体的な活動、実践であり、そうであればこそ、それはその他の資本の諸要素-不変資本のいかなる要素とも決定的に異なって、価値を創出し、したがってまた、余剰価値を創出する源泉となることができる - p172, 存立構造 "科学的管理法"とは周知のように、たとえば労働者の労働を個々の要素的な動作にまで解体し、各動作を最も効率的な手順に規格化して再構成する...労働者を物在化して認識しかつ操作する管理法である...五年余にわたる実験調査の結果、物理的作業以上に、生産能率を左右する要因として、1.労働者の感情的・心理学要素 および2.その集団的・社会的要素 の存在が確認される。要するにわが経営者は...労働者が人間であるという画期的にめずらしい発見をしたわけだけれども🤣...この経営の「哲学」はふつう、「人間中心的な思考」という風に称されている - p178, 存立構造 [12] この労働者の「全人間的」な把握としての「人間管理法」への転回の画期をなしたこの実験は...二つの視点から同時に把握されねばならない...この実験の全体をつらぬく問題意識は、あくまでも生産の能率ということにあり、<人間中心的な思考>は、この意味づけの磁場にあくまでも包摂されたものでしかないということ...しかし第二に、このような資本の論理を貫徹させるためには、労働者を物在化する「科学的管理法」は必然的に挫折せざるをえず、それはこの「人間中心的な思考」へと自己転回せざるを得なかったということ。それは労働力商品が、たんに主体なるものの客体化であるのではなく、主体でありつづけながら同時に客体であらねばならないという矛盾であるからであり、しかもまさしくこの矛盾そのものが、資本制的な生産の存立のダイナミズムを、その最深部において支えているからである - p178 [*] 現代社会の存立構造の骨格が素描されているだけであって、個別的な諸課題への応用による肉付けがなされていないが、台座をここまで固めておけば、組織形態、意識形態を含む諸分野・諸制度・諸事象の分析による豊穣な展開という作業は、時間さえ与えられれば可能であるという見通しを、私じしんはもっている - p199, 存立構造 e.g. 資本制体制自体の崩壊を免れようとするかぎり、諸資本の利害を媒介する機能としての国家権力の介入を要請せざるをえない - p196, 存立構造 --- [1] I wonder this is what 言葉と物 is about, also オリエンタリズム. コトバを媒介とする様相において、媒介となるコトバあるいはコトバのシステムが、理念、科学、芸術等々の文化諸現象として物神化される - p70, 存立構造 言説 is an interesting subject, seems to describe a lot about our experience. 消費はひとつの神話である。現代社会が自らについてもつ言葉、われわれの社会が自らを語る語り口、それが消費だ。いってみれば、消費に関する唯一の客観的現実は消費という観念だけである - p342, 消費社会の神話と構造 [2] Orientalism 国家というものを、自己の<対象的な主体>として要請せざるをえないという、共同体<->市民社会の歴史的な性格から出発してはじめて透徹して把握しうる - p66, 存立構造 [3] Those books written by such people must be interesting to read. 古典的には、シェイクスピアやモリエールやバルザックやゴーゴリやチェホフによって、現代にはルフェーブルやマルクーゼやアドルノやミルズやケニストンによって、把握に深浅の差はあれ抽き出されているように、このことは具体的には、次のような様相をとって現れる - p72, 存立構造 [4] Same 補強し完成する, just different kind of 垂直性の階級関係. 人間のために神があるのではなくて、神のために人間が存在するのであって - p152 ... カルヴァン派信徒が現世においておこなう社会的な労働は、ひたすら"神の栄光を増すため"のものだ - p166, プロテスタンティズムの倫理と資本主義の精神 [5] Its the same question we should be asking here haha. われわれの究明すべき点は...あの"合理的"な思考と生活の具体的形態は、いったいどんな精神的系譜に連なるものだったのか、という問題でなければならない。それも、この場合、とくにわれわれの興味を惹くのは、この"天職"概念のうちに、存在する、この非合理的要素はどこからきたのか、ということなのだ - p94, プロテスタンティズムの倫理と資本主義の精神 [6] Faust-like? 進歩、昇華、労働、合理性、能率などのピューリタン的・プロメテウス的企てに結びついた罪の意識を、悪魔に代表される悪の力において主題歌しつづけてきた。抑圧の対象になったものがふたたび姿を現し、主人公につきまとい、魂を売り渡すという中世的テーマが産業革命時代の開始とともにロマン主義たちによって蘇ったのもそのためである - p337, 消費社会の神話と構造 Sadly, even heretics can no longer exist today, according to Baudrillard. われわれの魔術は白く、豊かさのなかには異端はもはや存在しえない。それは飽和状態に達した社会、眩暈も歴史もない社会、自ら以外に神話をもたない社会の予防衛生的白さなのである - p347, 消費社会の神話と構造 [7] Maybe 直接的労働過程および直接的消費過程を共にする限りの他者 is 理性と言語能力の必然的な帰結, but 集列的関係の他項としての、固有の意味での他者性 is not?🤔 分業とはじつに多くの利益を引き出してくれるものだが、もともとこれは人間の英知 - それがもたらす一般的な富裕を予見したり、意図したりするような英知 - の産物ではない。そのような広範な有用性などまったく予見しない人間の本性のなかに一定の習性が、きわめてゆっくりと、徐々にもたらした結果ではある...このような習性が、ここではこれ以上詳しく述べることができない根元的な人間本性に属するものか、あるいはずっとありそうなことだが、理性と言語能力の必然的な帰結であるのか、ということは当面の研究課題ではない - p45, 国富論 [8] Maybe we can say that our society, 諸個人の集列的な関連そのものとしての"市民社会", is strongly characterized by 固有の意味での他者性. They are even worshiped in a sense, its the very nature of our Society of Singularities. I don't know(yet?) if its because of 市民社会's <譲渡をとおしての領有>という、社会性の次元において媒介された構造, but the point is that not universal at all, イロクォイ族 even despises it haha. 論理的に見て固有名はまことに低い評価しか与えられていていない。それは"クラス外"の人間の印である..."親戚の者に関しては、本人に向かっていう場合にも第3者に向かっていう場合にも、個人名を用いることはけっしてしない...個人名を使うのがふつうなのは会話の中で親戚でない人間のことを言う場合に限られ、しかもその場合においてさえ、もしコンテキストで誰のことを言っているのかわかるなら個人名は使わないようにする" したがってイロクォイ族においても、さきに述べた相違があるにもかかわらず、個人が"クラス外"に置かれるのは、そうする外はない場合に限られる - p235, 野性の思考 [9] <->伝統志向に依存する<共同態的>社会における個人 - p9, 孤独な群集 高度成長潜在的な社会は、人工をおさえるための"犯罪"をもふくめて、その社会的慣行が制度化され、定型化されている、という意味では安定している...わたしが伝統的社会と名づけたものは、"共同態"(集合態)に対してと言った用語で示される...いづれも変化のスピードが相対的に低く、家族や血縁集団への依存度が高く、かつ、それ以後の時代にくらべて価値体系が固定している - p10, 孤独な群集 固有名は...ペナン族のように...体系の論理的支払い能力を、つまりしかるべき時に債権者<子供>に1クラスを供給する能力をあてにして振り出された手形にすぎぬものでしたかない...新しいメンバーが加わるごとに構造があらためて問題化するという危険性をはらんでいる...この問題には...生まれてくる子供を入れられるだけの空いた位置が予備にいくらかあればそれでよい。使える位置の数がつねに人口を上回っておれば、少なくとも理論的には、共時態は通時態の気まぐれに左右されない - p236, 野性の思考 死の起源についてのフォックス・インディアンの神話では、近親者を失ったものに対して、つぎのように告げる。"お前たち(お前と死者)はお互いに永久に別れを告げるのじゃ...お前は誰かを跡継ぎにしなくてはならぬ...そうすればお前は、跡継ぎの者とはまったく同じ親族関係になるのじゃ" - p239, 野性の思考 伝統的思考に依存する社会での個人は、その社会の他の成員にたいして、明確な機能的関係をもっているからである。かれは集団に"所属"している...かれが"所属"しているというまさにその事態のゆえに、"かれ"の意識的選択によってえらばれる人生の目標は、きわめて小さい範囲内にしかない...したがって、個人的な選択の問題は、高度成長潜在期の初期には、それを固定した社会組織のなかに組み込むことで解決できたが、過渡的成長期にあっては、剛直でしかも個性化された性格によって解決されねばならぬ - p12, 孤独な群集 西洋ではこの"トーテミズム"が人間化[個人化]されているだけである。西洋文化においては、まるで個人がそれぞれ自分の個性をトーテムとしているかのようである。個人の存在を所記とすれば、個性はその能記なのである...固有名詞は...分類体系の延長であるとともに、その限界でもある...名詞が*どれだけ固有性をもっているか*は、名詞の内的性質からは決定されないし、また他の単語との比較からだけではきめられない。それは、おのおのの社会が分類作業をいつ打ち切るかで決まるものである - p258, 野性の思考 [10] 神のものにくらべられる講社の沈黙の機能はあらゆる種類の憶説を生む。ある憶説は...別の憶説は...さらにべつの憶説は仮面の教祖の口を借りて、講社はかつて存在したことがなく、将来も存在しないだろう、という。これにおとらず卑しいべつの憶説は、バビロニアそのものが偶然の無限の戯れにほかならないのだから、曖昧な組織の現実性を肯定するのも否定するのも所詮はおなじことである、と主張する - p91, バビロニアのくじ [11] I wonder where I picked it up haha. 注意や創意を必要とするような製品の製造が問題となる場合には、低賃金はつねに資本主義の発展の支柱としてまったく役立たない。こうした場合には、低賃金は利潤をもたらさず、意図したところとは正反対の結果を生むことになる。なぜなら、こうした場合には端的に高度の責任感が必要であるばかりか、少なくとも勤務時間の間は、どうすればできるだけ楽に、できるだけ働かないで、しかもふだんと同じ賃金がとれるか、などということを絶えず考えたりせずするのではなくて、あたかも労働が絶対的な自己目的であるかのように励むという心情が一般に必要となるからだ。しかし、こうした心情は、決して、人間が生まれつきもっているものではない。また、高賃金や低賃金という操作で直接作り出すことができるものでもなくて、むしろ、長年月の教育の結果として、はじめて生まれてくるものなのだ。今日では資本主義は堅固な基礎がすでに出来上がっているから、どの工業国でも、またそれらの国々のどの工業国でも、労働者の調達は比較的安易だ。しかし、昔は、きわめて困難な問題だった - p67, プロテスタンティズムの倫理と資本主義の精神 [12] 「人間関係」の専門家が提示しているモラールは、疎外された存在でありながら、管理された型とおりのやる気はもつように期待され、それに応えてきた人間のモラールである。今ある産業という枠組みは変えられるものではないということ、そして管理者のめざしていることを万人がめざしているということを前提として、「人間関係」の専門家たちは現代産業がもつ権威的な構造、そこにおける労働者の役割については検討を加えない。彼らは、限られた用語でモラールの問題を規定する。そして、クライアントである管理者に対して、従来の権力の枠組みにおいて従業員たちのモラールをどのように改善できるかを、技術の枠をつくして鮮やかに示そうとする...そのためには、そうした「非協力的」傾向を容認し、研究し、単に権威的に労働者に命令するのではなく、労働者を操作するのが適切であろう - p166, 社会学的想像力 先生というのは、ちょうど他人指向的な親たちが「納得づく」の方式と操作によって子供を取り扱うのと同じように、権威という切札をもちながらも、その権威をかくして子供たちをかかわりあっている、というのが実状なのだ...現代の学校というのは...そこでの小さなクラス編成の中での教師の役割は、近代的工場の中での人間関係を処理する部門の役割となんとなく似ているようである。この人間関係の処理の部門というのは職場での同僚の間での、そして経営者と労働者との間での協力を目標とするものである - p55, 孤独な群集 [13] <->人間としての人間の歴史 近代社会では、「労働・生産」は単独に突出し、それに応じて「自然と闘い、自然を征服し、自然を変形する」労働という表象も成立したが、「労働」が社会的諸活動に分散的に埋め込まれている社会では、自然と人間とのシャープな切れ目はなく、また切れ目があってもそれを縫い合わせる観念体系が作られる - p35, 仕事 [14] 人間としての人間の歴史 プロメテウスは、人間と神とを切断する媒介の機能を果たしている...「火を盗む」行為は、罰を代価とした新しい人間の創造の行為でもあった...こうして生まれた人間の命は、自然に保証されるのではなくて、人為によって保存され維持されなければならない - p44, 仕事 [15] <->公的な領域 ビッグ・マンは政治権力者であるよりも、マージナルな人格である。マエンゲの社会では、貨幣取引をビッグ・マンの空間に閉じ込めて、商業が共同体に流入することを防いでいる。労働表象と商業表象との対立関係を軸に形成される倫理的評価体系が商業の侵入への防壁になる - p34, 仕事 [16] マンエゲ族における労働、ヘシオドス的「労働」 [*] 記号の内部に存在する要請された主体、遠近法の不在 消費的人間は自分自身の欲求と自分の労働の生産物を直視することもなければ、自分自身の像と向かいあうこともない。彼<資本によって内化された主体>は自分で並べた記号の内部に存在するのである。超越性も目的性も目標ももはや存在しなくなったこの社会の特徴は、「反省の不在」、自分自身についての遠近法の不在だ。したがって、富と栄光を手に入れるためにファウスト的契約を交わすべき相手である悪魔のような不吉な審級も存在しない...<資本制社会>が悪魔と契約を交わし、豊かさと引換に一切の超越性と目的性を売り渡してしまったので、今や目的の不在に悩まされていると考えるべきだろう - p339, 消費社会の神話と構造 Its an interesting process, discovering society within myself. So much to learn from them! 人々が、自分で考えているよりもはるかに自由なのだと教えること、人々が自明で真理だと信じているいくつかのテーマが、歴史の特定の時点に作り出されたものであり、このみかけのの上での自明性は批判し、破壊することができるものだということを示すことです。人々の精神において何かを変えること、それが知識人の役割です - Foucault
「まだ思惟されていないもの」の豊かさ by Ryo
加害者に対して発せられる被害についての怒りからして刑罰は行われたのだ。ーしかしこの怒りは、すべての損害にはどこかにそれぞれの等価物があり、したがって実際にー加害者に苦痛を与えるという手段によってであれーその報復が可能である、という思想によって制限させられ変容させられた。ーこのきわめて深い、深く根を張った、おそらく今日ではもはや根絶できない思想、すなわち損害と苦痛の等価という思想は、どこからその力を得てきたのであるか - ニーチェ いうまでもなく、ニーチェはそれを、売買や交易の形式のなかに見出す。とはいえこの置き換えによって問題がいささかも容易にならないことに注意するべきである。また、このおきかえは、問題を経済学に移行させることはできない。逆に、経済学を根本的な疑問にさらすことだ。相異なる商品の「等価形態」とはなになのか、とマルクスが"資本論"の冒頭で問うたとき、彼はあらゆる難問をそこに凝縮させたことになるのである - p44, マルクスその可能性の中心 マルクスは、アリストテレスの"歴史的限界"を指摘しているだけのようにみえる - p47, マルクスその可能性の中心 かかる等置は、諸物の真の本性にとっては外的なものたりうるのみであり、かくして「実践的欲望のための応急策」たりうるのみである...とういわけは、ギリシャの社会は奴隷労働にもとづき、かくして人間および彼らの諸労働力の不等性を自然的基礎としたからである。価値表現の秘密、すなわち、すべての労働が、人間的労働一般であるがゆえの、またそのかぎりでの、すべての労働の同一な妥当性は、人間の同等性の概念がすでに国民的成心の固定性をもつときにのみ解決されうる。だが、それは、商品形態が労働生産物の一般的形態であり、かくしてまた、商品所有者としての人々相互の関係が支配的な社会関係であるような、そうした一社会においてはじめて可能である - *資本論 マルクスはなぜ古典は経済学をつぎのように批判したのか...ここには、「人間の平等」という思想がまぎれこんでいる。最初にいったように、その思想そのものが"等価性"に根ざしているのだから、肝心の問題、異質なものがいかに等価形態をとるのかという問題を素通りして同義反復をやっているにすぎない - p48, マルクスその可能性の中心 労働諸生産物は、それらが価値であるかぎりでは、それらの生産に支出された人間的労働のたんに物象的な表現である、という後代の科学的発見は、人間の発達史において時代を劃するものだが、しかしけっして労働の社会的性格の対象的仮象を追いはらいはしない - *資本論 マルクスは「人間は等しい」という考えはアプリオリな真理なのではなく、それ自体「商品形態が労働生産物の一般的であるような社会」においてはじめて可能だというのである - p49, マルクスその可能性の中心 すると、貨幣形態またはそれにもとづく思考は形而上学的であり、その批判は、経済学にとどまらず、一切の形而上学への批判と化すのである。あるいは、形而上学の根底に、「貨幣形態」が存在するといってもよい - p50, マルクスその可能性の中心 "矛盾"とは、したがってまた"弁証法"とは、すでに生成したものを生成したあとから合理化することでしかない。哲学とは、一種の神経症的な合理化にすぎず、それは貨幣=音声的文字の結果としての「意識」に閉じ込められている - p40, マルクスその可能性の中心 それゆえにこそ「貨幣形態」の起源への問いが困難なのであって、いつも形而上学的なわなにはまってしまう。マルクスの弁証法的な叙述も例外ではない - p50, マルクスその可能性の中心 労働力の不等性, 人間の平等性 思惟することが問題である場合には、なされた仕事が偉大であればあるほど、この仕事のなかで「思惟されていないもの」、つまりこの仕事を通じ、またこの仕事だけを介して「まだ思惟されていないもの」としてわれわれのもとに到達するものは豊かである - ハイデガー
問題の認識と定式化 by Ryo
I should start with try having such awareness, its the awareness to live by. 現代において論点となっているのは、人間の性質そのもの、私たちが人間としての限界と可能性について持っているイメージなのである。歴史は「人間性」の限界と意味をまだ探求し終えていない...人間としての人間の奥深くには自由を求める衝動と理性的に考える意志が存在するのである、という人間性の形而上学を想定するだけでは、もはや不十分だろう...自由とは、単に望み通りに行う機会ではないし、単に所定の選択肢のなかから選ぶ機会でもない。自由とは、第一に、可能な選択肢を定式化し。それについて論じるチャンスであり、そしてその次に選択する機会である ここで最も言いたいのは、理性と自由という価値を受け入れたのであれば、自由の限界と、歴史における理性の役割の限界を確定させるのが、社会科学者の第一の使命だということである...彼がたまたま生活している生活圏を知的に越えることこそ、まさに彼の使命であり...歴史変動の性質と、もしあればそこにおける自由で理性的な人間の場について、自分自身の見解を定めることなのである。そうして初めて彼は、自分が研究している社会における自らの知的・政治学的役割を知るようになり、その際、非常に深いところで社会科学の伝統と約束の一部である自由と理性の価値について、自分が実際にどう考えているか気づくのである - 社会学的想像力
気流の鳴る音 by Ryo
I sometimes feels the emptiness as described in p143 these days. Also I found myself unsure where to ground myself as described in p140, or in p173. But at the same time, I recently learned to be amazed as described in p147. I honestly don't understand what he was trying to tell with age. But I do kind of get what is told by the song in p160, or maybe not. The only thing I know for sure is that there are yet so much to learn, like if I were destined. 「人間は学ぶように運命づけられておるのさ。」ドン・フアンが言う - p165, 気流の鳴る音 I'll see haha.
明晰さから見えてくる人間の豊かさ by Ryo
社会心理学と歴史心理学の諸問題は、多くの点で、私たちがこんにち研究できる最も面白い問題である。現代の、それどころか西洋文明の主要な知的伝統が合流して、いま最も刺激的なのは、この分野である。現代においては「人間性の本質」-啓蒙主義から引き継いだ人間の生成的イメージ-が問われてきたのはこの分野である。全体主義政府の勃興によって、民俗学的相対主義によって、人間の大きな潜在的非合理性の発見によって、人々が歴史的にきわめて急速に変容してみえることによって、人間性の本質が議論の対象になってきた - p267, 社会学的想像力 「呪術師の世界」は、「ふつうの人の世界」の自明性をくずし、そこへの埋没からわれわれを解き放ってくれる翼だ。しかし一方「呪術師の世界」を絶対化し、そこに入りきりになってしまうと、こんどはわれわれはその世界の囚人となる。<見る>ことと呪術の関係について、ドン・ファンはまたこうも言う。<呪術師の世界の見方>を学んだ者でも、<見る>ことを学ぶとはかぎらない。むしろある意味では、<見る>ということは、呪術の反対でさえある...「見ることのできる奴はすべてだ。それに比べたら呪術師なぞ悲しいものさ。」 - p84, 気流の鳴る音 人類史のなかで示される人々の広大な多様性について少し考えてみればよい。社会科学者だけでなく心理学者も、文章を書き終える前に、その主題が「人間」であるということをしっかり考えるべきである。人間の多様性とは、私たちの知るいかなる「要素」心理学、「本能」心理学、「本能」理論、「基本的な人間性」の原理をもってしても、人間の諸類型や諸個人のとてるもない多様性を説明することができないような多様性である。人間について、人間生活の社会的歴史的現実に内在するものを離れて主張できることは、人類の生物学的限界の幅広さと可能性だけであろう。しかいその限界内で、そしてその可能性から、人間の諸類型の一大パノラマが広がっている。それを「基本的な人間性」という理論で説明しようとするのは、「人間性」についての<概念>の貧弱で小さな檻のなかに、人類史そのものを閉じ込めることである。 - p276, 社会学的想像力 「お前は世界を止めたんだ。」「その止まったものってなんだい?」「人が世界はこういうものだぞ、とおまえに教えてきたことさ。わかるか、人はわしらが生まれたときから、世界はこうこうこういうものだと言いつづける。だから自然に教えられた世界以外の世界を見ようなぞという選択の余地はなくなっちまうんだ。」 - p85, 気流の鳴る音 無知に耽溺するものは あやめもわかぬ闇をゆく 明知に自足するものは、しかし いっそうふかき闇をゆく "indulge"とは、まさしくこの「耽溺する」「自足する」という意味に他ならない。それはたとえば慢性中毒者などが、酒や麻薬にふけって、そこからぬけだせなくなっている、そういうイメージをもっている。いわば<自己の惰性に身をゆだねること>。ドン・ファンはカスタネダの、合理的に説明しようとする強迫を、ひとつの"indulgence"としてとらえる。つまり、合理的主義的な世界の自己完結性、自足性を、ひとつ<明晰さ>の罠として、人間の意識と生き方をその鋳型の中におしこめる一つの閉ざされた「世界」として把握する - p96, 気流の鳴る音 自分自身およびその社会的立場について、真に適切な「明晰な」見解を持つ人間集団は稀である。一部の社会科学者の用いる方法がしばしば想定しているように、その反対を想定するということは、18世紀の心理学者ですら認めないほどの、理性的な自意識と自己認識を想定することである。「ピューリタン」、その動機、宗教制度と経済制度におけるその機能についてのマックス・ヴェーバーのアイディアのおかげで、私たちはピューリタンについて本人よりもよく理解できる。ヴェーバーは構造という概念を使うことによって、個人とその生活圏についての「個人の自分の認識」を越えることができたのである - p274, 社会学的想像力 将来この鉄の檻の中に住むものは誰なのか、そして、この巨大な発展が終わるとき、まったく新しい預言者たちが現れるのか、あるいはかつての思想や理想の力強い復活が起こるのか、それとも-そのどちらでもなくて-一種の異常な尊大さで粉飾された機械的化石と化することになるのか、まだ誰にも分からない。それはそれとして、こうした文化発展の最後に現れる「末人たち」にとっては、次の言葉が真理となるのではなかろうか。「精神のない専門人、心情のない享楽人。この無のものは、人間性のかつて達したことのない段階にまですでに登りつめた、と自惚れるだろう」と。 - p366, プロテスタンティズムの倫理と資本主義の精神 バルザンとグラフは次のように述べている。「人間性というのは概念そのものが、社会科学の一つの想定なのだから、それがその報告の主題となると言うと、本質的な論点を避けることになる。そこには<人間文化>というきわめて変わりやすいものしか存在しないかもしれない」 - p276, 社会学的想像力 ドン・ファンはただ平静であり、人間のとらえうるものが<世界>の神秘のほんの微小な部分にすぎないことを対自化しうるほどにまで冷静であればこそ、人間的知性の説明体系の自己完結性などを信じていないのだ - p98, 気流の鳴る音 私たちはたまにはその謎(<人間>の豊かさ)にふけり、結局自分たちはその謎の一部なのだと感じたいこともあるし、多分そうするはずである。しかし西洋人である私たちは、人間の多様性を研究することも避けられないだろう。それは私たちにとっては、視界に入る人間の多様性から謎を取り除くという意味である。その際、私たちが研究しているものが何であるか。人間と歴史と個人史についていかにわずかしか知らないか、私たちがその被造物であると同時に創造者でもある社会についていかにわずかしか知らないか、忘れないようにしよう - p277, 社会学的想像力 「明晰」とはひとつの盲信である。それは自分の現在もっている特定の説明体系(近代合理主義)の普遍性への盲信である。「なんでも知っているようにふるまうよりは、どのヤブにウサギがかくれているか知らない方がずっとすばらしいさ。」 - p118, 気流の鳴る音 I do like to believe we are destined for such. 「人間は学ぶように運命づけられておるのさ。」ドン・フアンが言う - p165, 気流の鳴る音
機関車ヒョーヒョー号 by Ryo
ある日、<ヒョーヒョー号は>線路からはずれて草原で花を見付けてすっかり喜んでしまった。そしてこの規則違反は見つかってしまう...そこ<線路>では先生が緑色の旗をもって戻ってくるようにと呼びかけているのであった。停止信号に関して、かれは一種の反射条件をもっている。その条件反射の連続でかれの頭は困乱してしまった。だから線路をめざして真直ぐに帰っていく <ヒョーヒョー号は>結局のところ、安全信号に従っているかぎり、成功と承認と自由さえもがあるのだということを学ぶのだ。このような道徳はたとえば、「赤ずきん」のような昔の話しとずいぶん違っている。赤ずきんもまた、おばあさんの家に行く途中、道草をくう。そして道草をくっている間に自然の美しさを教えてもらう...この物語はなにか善いことをしたからそれになんらかの報酬があるのだということをはっきりと示すものでもないし、また大人の世界を慈愛に満ちたものとして描き出してもいない。従って、赤ずきんの物語はちょっとした見たところ空想的に見えて、本質的にはリアリスティックな物語なのである ところでこの物語にはおまけがついている。物語の終りになるとヒョーヒョー号は花を好きであったということを忘れてしまうのである。機関車や信号や線路、そして集会といったようなもので代表される大人の世界に比べたら、花なんて幼稚だというわけだ - p96, 孤独な群集 自分自身に語りかけることがなくなり、自分の歌を作るということをしなくなり、また自由な夢を描くことをしなくなるのだ、というふうな考え方ははたして正しいのだろうか - p97, 孤独な群集 子供たちは、書物や戯曲に接することによって、親たちとはまったく異なった人生の中でどのように生きてゆくべきかを学びとる - p85, 孤独な群集
資本論の読む際のメモ書き(2) by Ryo
行為事実的な関係について - p286, 存立構造 人間が自分たちの労働生産物を価値としてたがいに関係つけるのは、けっして交換する物が同種の人間労働の物的な外皮として通用しているからではない。事実はまったく逆だ。人間は、異なる種類の生産物を人間労働としてたがいに等置している。人々は、そうであることを知らないままに、そのように行動している。だから価値が何であるかは、価値の額には書かれていない。むしろ価値は、あらゆる労働生産物を一つの社会的な神聖文字に書き換えてしまう。後になって人間たちは、自分自身の社会的生産物の秘密を探るために、この神聖文字の意味を解読しようとする。なぜなら、使用対象を価値として規定する行為は、言語と同様、人間が社会的に生み出したものだからだ - p146, 商品のフェティシュ的性格とその秘密 [17] 商品交換の関係(単純な価値形態)の非対称性と行為事実的な関係 - p299, 存立構造 見ようによっては、人間も商品と同じだ。だれしも鏡を手に生まれてくるわけではなく、「わたしはわたしだ」などとというフィヒテ流の哲学者として生まれてくるわけでもない。だから人間はまず他者のなかに自分の姿を映してみる。人間ぺテロは、自分に等しいものとしての人間パウロに関係することによって、はじめて人間としての自分自身に関係する。しかしぺテロにとっては、パウロはあくまで肌と髪を備えた存在であり、そのままの状態で人間という類の現象形態とみなされる - p108, 相対価値形態の内実 [18] --- [17] 「我々は、社会的産物という特色をもっている現象のみを、記号学の対称と認める。換言すれば、ラングは記号学的産物であり、記号学的産物は社会的産物である、ということである。しかし、その正体はなんであろうか。いかなる記号学的体系もさまざまな次元に属する複雑な単位群から構成されているが、これらの単位の真の性質は-これこそ記号学的単位を他の事物と区別するものであるが-価値であるということなのだ。記号の体系という単位の体系は、価値体系にほかならぬ。経済学をも含めて、あらゆる次元の価値は記号である。いかなる価値といえども個的存在ではあり得ず、記号は体系の容認によってしか即時的な価値をもつには至らないであろう... 」 ソシュールはここで、記号学の体系を一切の社会的産物と規定し、自然的指標を除外します...一見、事物それ自身が有するかに見える客観的価値、有用性、使用価値といったものも、実は文化体系のなかだけで機能する交換価値、象徴価値と同じ本質をもつ関係的存在に過ぎないということがわかります - p66, ソシュールを読む [18] 消費と流行のサイクルに入りこむことは、自分の好みに合うモノやサービスに取り込まれるようになることばかりではなく、自分自身の存在の意味そのものを変えることでもある。それは自我のもつ自律性・性格・固有の価値にもとづいた個人的原理から、個人の価値を合理的に減少させ、変動させるコードに従って行われる...その結果、個人はもはや自律的価値の中心ではなく、流動的相互関係の過程における多様な一項にすぎなくなる - p298, 消費社会の神話と構造 他人指向型の人間は、ある意味で、あらゆる場所で健在でありうる。あるいは、逆の言い方をすれば、安住の地がどこにもないということもできる。かれは、だれに対してでも、すばやく反応する能力をもちあわせているのだ。もっとも時として、その親しさは、皮相的なものであるけれども - p20, 孤独な群集
バベルの塔 by Ryo
彼らは精神とは一切の関係を持とうとはせず、新世代は、世界がまるで先人たちの足跡も無ければ、申し送られた複雑な問題も無い天国(楽園の東にあたるあたり)であるかのようにして、世界を手中に収めようとしていた - p120, 大衆の反逆 Just how we went trough Heliocentrism, I wonder if we can get over The Tower of Babel. The stars must have a lot better view from there. 私たちは自分たちが狭く閉ざされた場所から逃れ出て、再び星空の下に立ち、最善のことも最悪のこともすべてが可能な、真正で深淵で、恐ろしく見通しのきかない底知れない世界(遥かに幸多き楽園)に出たのだという、えも言われぬ印象を持つのである - p95, 大衆の反逆 It just that you need to keep studying. 必要なことは、ただひたすらにお前の 知識に、それにふさわしい行為を加え、信仰を加え、美徳と 忍耐と節制を加え、さらに、やがて聖き愛という名称で呼ばれる はずの、そして他の一切のものの魂である愛を、加えることだ。 そうなれば、お前もこの楽園から出てゆくことを嫌とは 思わないであろう。自分の内なる楽園を、遥かに幸多き楽園を、 お前はもつことができるからだ。 - 失楽園 And people will help you out along the way. 人々が、自分で考えているよりもはるかに自由なのだと教えること、人々が自明で真理だと信じているいくつかのテーマが、歴史の特定の時点に作り出されたものであり、このみかけのの上での自明性は批判し、破壊することができるものだということを示すことです。人々の精神において何かを変えること、それが知識人の役割です - Foucault
s/民族/歴史/ by Ryo
民俗学的な好奇心の秘かな動機を自分の心の中に尋ねるようになる。表面的には自分たちの習慣とは非常に違う習慣のおよぼす魅惑、それらが私たちに起こさせる親近感と違和感の入りまじった矛盾した感情、それらは、これらの習慣が見かけよりは私たち自身の習慣にずっと近いものであるために起こるのではないか?それらの異なる社会慣習は、われわれ自身の慣習の、謎に満ちた、解読を求めている姿を見せてくれるのである - p251, 野性の思考
由々しき分離 by Ryo
Its nice to see 異なる精神, and realize there is 精神的系譜 among them.
ルッターがツウィングリのなかに彼自身とは"異なる精神"が生きているのを見たように、彼の精神的後裔たちもまた、とくにカルヴィニズムのうちに、そうした異なる精神を見たのだった。...ダンテの"神曲"の末尾で天国に到りついた詩人がいまや充ち足りて言葉もなく神の神秘を直視している叙述をとって、これをあの"ピュウリタニズムの神曲"と呼ばれているミルトンの"失楽園"と比較してみるがよい - p127, プロテスタンティズムの倫理と資本主義の精神
彼らは、ふりかえり、ほんの今先まで
自分たち二人の幸福な住処の地であった楽園の東にあたる
あたりをじっと見つめた。その一帯の上方では、神のあの焔の
剣がふられており、門には天使たちの恐ろしい顔や燃えさかる
武器の類が、みちみちていた。
...
必要なことは、ただひたすらお前の
知識に、ふさわしい行為を加え、信仰を加え、美徳と
忍耐と節制を加え、さらに、やがて聖き愛という名称で呼ばれる
はずの、そして一切のものの魂でもある愛を、加えることだ。 - 失楽園
ピュウリタニズムの現世に対する厳粛な関心というか、あるいは世俗内的生活を使命として尊重する態度の、こうしたこの上もなく力づよい表現は、中世の著述家の筆では、とうてい不可能だったことは、誰でも感得できるだろう - p129, プロテスタンティズムの倫理と資本主義の精神
オランダでは..."旧約の復興"と、それから、第2イザヤおよび"詩篇"第22篇まで遡るところの、あの芸術における反美的なキリスト教的感覚を目指す敬虔派的志向とが、醜いものをより多く芸術の対象とする傾向を助長せざるをえなかったこと、そしてそこにはピュウリタンの被造物神化への拒否も一因として作用していたこと、は容易にわかる...レンブラントの名画の名画"サウルとダビデ"の前に立つ者は、ピュウリタン的感覚の強い影響力をじかに感得しえたように思う - p334, プロテスタンティズムの倫理と資本主義の精神
わたしを遠く離れないでください。
悩みが近づき、助ける者がいないのです。
多くの雄牛はわたしを取り巻き、バシャンの強い雄牛はわたしを取り囲み、
かき裂き、ほえたけるししのように、わたしにむかって口を開く。 - 詩篇, 第22章
Literature and paintings are interesting medium of 精神. Its about recognizing 模範 and 規範 of the past, realizing that we are not この地上に一人取り残されてしまったこと.
私たちは、あらゆるあらゆる古典主義を白紙に戻して、いかなる過去のうちにも模範や規範を認めようとはしない時代に、今ここに至って初めて出会っている...後ろを振り返ってみても、かの有名なルネサンスなどは、私たちにはごく狭い、田舎臭い、空しい身振りの、気障な時代に思えるのである..."こうした過去と現在の由々しき分離は、現代の一般的事実であり...それが近年、一種独特な生の混乱を生み出している。私たち現代人は、ある日突然自分たちがこの地上に一人取り残されてしまったこと、死者たちは冗談ではなくまさに完璧に死んでしまったこと、彼らはもはや私たちを助けることなどできないことに気づくのだ" - p99, 大衆の反逆
I think they can serve as a reminder of 由々しき分離, just like the Marilyn reminds of 現代的感覚.
ファウスト的な人間の全面性からの断念 by Ryo
この映画<プラハの大学生>の主人公の鏡に映った像は、われわれの行為の意味を象徴的に表現している...この像の忠実さは、こういってよければ、世界とわれわれとの現実的な相互関係について証言してくれる。したがって象徴的にいえば、この像を失うことは、世界が不透明になり...われわれは自分自身についての遠近法さえ失ってしまう。この遠近法がなければ、もはやいかなる自己証明不可能だ - 私は私自身にとってひとりの他者となる、つまり疎外されるのだ...売られるのだ。商品の領域に属するようになるといってもよいが、これこそ具体的な社会的疎外の意味そのものである。悪魔がこの像をひとつのモノとしてポケットにしまいこむという場面も、商品が物神化される現実的過程の幻想的描写となっている - p333, 消費社会の神話と構造 "プラハの大学生"は、疎外過程つまり商品の論理に支配される個人的・社会的生活の全体像を見事に描写していたが、ヨーロッパでは中世初期以来、悪魔との契約譚は自然を支配する歴史的・技術的過程が始まった社会の中心的神話なのである。西欧の"魔法使いの弟子"は、進歩、昇華、労働、合理性、能率などのピューリタン的・プロメテウス的企てに結びついた罪の意識を、悪魔に代表される悪の力において主題化しつづけてきた - p337, 消費社会の神話と構造 彼<ゲーテ>にとって、この認識は、ゆたかで美しい人間性の時代からの断念を伴う、そうした袂別を意味した。そうした時代は、古代に当てないの全盛期がくりかえし現れなかったのと同様に、われわれの時代の発展のなかでもう一度現れてくることはもはやないのだ...そして、この秩序界<近代的経済>は現在、圧倒的な力をもって、その機構の中に入り込んでくる一切の諸個人の生活スタイルを決定しているし、おそらく将来も、化石化した燃料の最後の一片が燃えつきるまで決定しつづけるだろう - p365, プロテスタンティズムの倫理と資本主義の精神 消費的人間は自分自身の欲求と自分の労働の生産物を直視することもなければ、自己自身の像と向かいあうこともない。彼は自分で並べた記号の内部に存在するのである。超越性も目的性も目標ももはや存在しなくなったこの社会の特徴は、"反省"の不在、自分自身についての遠近法の不在だ。したがって、富と栄光を手に入れるためにファウスト的契約を交わすべき相手である悪魔のような不吉な審級も存在しない。なぜなら、それらは母性的で幸福な雰囲気つまり豊かな社会そのものによってはじめから与えられているからだ。あるいはまた、社会全体が有限責任の株式会社となって悪魔と契約を交わし、豊かさと引き換えに一切の超越性と目的性を売り渡してしまったので、今や目的の不在に悩まされていると考えるべきだろう - p339, 消費社会の神話と構造 Obviously we are not alone, and how ignorant and arrogant would be to lose respect to all those people. There is a lot to learn from them. さしあたって私たちの生は、どの生よりも大きく感じられる。没落しているなどと感じることができようか。まったくその反対である。つまり自らをより生であると感じているために、過去に対するすべての尊敬の念、全ての関心を失ってしまったのだ。そのため私たちは、あらゆる古典主義を白紙に戻して、いかなる過去のうちにも模範や規範を認めようとはしない時代に、今ここに至って初めて出会っている..."私たち現代人は、ある日突然自分たちがこの地上に一人取り残されてしまったこと、死者たちは冗談ではなくまさに完璧に死んでしまったこと、彼らはもはや私たちを助けることなどできないことに気づくのだ。残っていた伝統的精神は霧散してしまった。模範、規範、基準も役に立たない。私たちは自分たちの問題を、それが芸術、科学、あるいは政治のそれであれ、過去からの実際的な協力なしに、吹きっさらしの、今ここの現場で解決しなければならない" - p100, 大衆の反逆
失楽園 by Ryo
彼らは、ふりかえり、ほんの少し今先まで 自分たち二人の幸福な住処の地であった楽園の東にあたる あたりをじっと見つめた。その一体の上方では、神のあの焰の 剣がふられており、門には天使たちの恐ろしい顔や燃えさかる 武器の類が、みちみちていた。彼らの眼からはおのずから 涙があふれ落ちた。しかし、すぐにそれを拭った。 世界が、 - そうだ、安住の地を求め選ぶべき世界が、いまや かれらの眼前に広々と横たわっていた。そして、摂理が彼らの 導き手であった。二人は手に手をとって、漂泊の足どりも 緩やかに、エデンを通って二人だけの寂しい路を辿っていった。 - 失楽園 豊かさは楽園、つまり道徳を跳び越えて夢にまで見た不道徳なぜいたくを手に入れることではなく、新しい道徳に支配される客観的状況ということになる...幸福にも耐えられない弱い人間たちを豊かさの真っ只中で反目させ、機会があれば豊かさに反逆して立ち上がらせるのは、過去でも伝統でもないし、原罪の烙印でもないことは明らかだ...罪の意識、"漠然とした不安"、根深い違和感などは現在のシステムそのものの中心部に位置しており、システムの論理的発展につれて生み出されるのである - p311, 消費社会の神話と構造 必要なことは、ただひたすらにお前の 知識に、それにふさわしい行為を加え、信仰を加え、美徳と 忍耐と節制を加え、さらに、やがて聖き愛という名称で呼ばれる はずの、そして他の一切のものの魂である愛を、加えることだ。 そうなれば、お前もこの楽園から出てゆくことを嫌とは 思わないであろう。自分の内なる楽園を、遥かに幸多き楽園を、 お前はもつことができるからだ。 - 失楽園
自己確証と同意 by Ryo
What is referred as 疎外され空疎化された主観 ... 連関の中の諸個人の、疎外され空疎化された主観の絶対性 - p46, 存立構造 ... must be the same as 個人 referred in below line. 個人はもはや自律的価値の中心ではなく、流動的相互関係の過程における多様な関係の一項にすぎなくなる...この自己への他者の内在化と他者への自己の内在化は、際限のない相互関係の過程に従って、社会的地位に関するあらゆる行動を支配している。ここには、厳密にいえば、個人的"自由"をもった主体もサルトル的な意味での"他者"も存在せず、人間関係の各項がその際の可動性によってのみ意味をもつ"雰囲気"が一般的になっている。この傾向は、要素としてのモノやモダンなインテリアのなかでのそれらのモノの組み合わせの場合に認められるのと同じ傾向である ...もはや絶対的価値をもたず、機能的融通性だけで成り立っているようなこの不安な関係の網の目のなかでは...他人に接触や同意を求めたり、判断や積極的つきあいを懇請したり...この同意への盲信がいたるところで自己確証への盲信に取ってかわろうとしている - p301, 消費社会の神話と構造 かくして彼は、モノとして存立するはずのこの疎遠な"法則"の全体系に、従属するものとして、いいかえればモノの運動の一環として自己自身を体験<自己確証>せざるをえない - p43, 存立構造 商業的目的としてのこの関係の生産 is an interesting perspective to look into 彼. I'll read 孤独な群集 for the next. この関係の生産はそれを専門にする企業にとって行われるのである。これらの企業にとっては、関係の生産こそが社会的かつ商業的目的なのだ - p302, 消費社会の神話と構造
主体の自己疎外と物象の再人格化 by Ryo
This reminds me of ... "社会"は、今やモノとして外在する対象にすぎないのだから、それらはただ利用し、適応し、拮抗すべき外的な条件にすぎず、自身の生を意味づける主体として存立しない...ところが同時に他方において、彼は自己自身の参与する協働連環の固有の力を外化し、疎外してしまっているから、彼はこの対象化された巨大な力に従属することによってしか生きられない...いまやこの対照的に存立する"構造"ないしシステムが本質的なものとなり、諸個人としての諸個人は偶然的なものとなる。かくして彼は、モノとして存立するはずのこの疎遠な"法則"の全体系に、従属するものとして、いいかえればモノの運動の一環として自己自身を体験せざるをえない - p42, 存立構造 ... this. 象徴的な意味では金貨も銀貨も、客体化された時間も排泄物だが、貨幣と時間に排泄物としての古風で供儀的な機能を与えることはほとんどないし、現在のシステムの下では不可能である...われわれを支配する計算と秩序においては、いわばその反対のこと<貨幣と時間からの解放>が起こっている。この秩序によって客体化され、交換価値として操作されているのはわれわれ自身であり、貨幣と時間の排泄物となったのもわれわれのほうなのである - p268, 消費社会の神話と構造 And below is another example of logically impossible, just like 時間の浪費の不可能性. したがって"挫折"を宿命づけられた抽象的"自由"の悲劇性、これこそがこの世界における主観性の<実存>的存立構造である - p44, 存立構造 This reminds me of ... このような自己物象化は、労働力そのものの商品化において、さらには労働過程そのものの機械システムへの従属において、いっそう高次元化し、具象化して完成させられる - p43, 存立構造 ... this. 一切は人為による共同幻想の世界ですから、それが非自然であればあるほど絶対的な価値などありません。"かくあるべし"という基準がないということは、変革の方向が見出せないということでもあり、人びとはひたすらに文化の抑圧に順応し、自らを共同幻想の中に組み込むことによってこれを強化し、硬直化させ、ますます非自由の世界に沈殿していきます。つまりラングという構造は、非自然的な体系であるがゆえに、いったん惰性化していきますと、ほとんど変革不能のような自体を起こします - p244, ソシュールを読む It also reminds me of the discussion regarding 歴史の本質. こういう<普遍的な>基準を打ち樹てようとする試みが非歴史的なもので、歴史の本質そのものと矛盾しているのです - p121, 歴史とは何か Lastly, the process of 自由な意志そのものの物象化された運動への適合 ... 現実には、物象化された事態の運動が、この運動に編入されている諸個人のうちに、固有の欲求や理念をつくりだし、この欲求や理念が諸個人をその内面から駆りたてて、みずからをこの<物の運動>の担い手 - "自由に意志した"担い手たらしめる...疎外された欲求や理念を媒介とし<た>...自由の凌辱が...ベンサム的形態<利害関心の回路>をとるか...カント的形態<理念>をとるか...は、二次的な問題にすぎない。事実たとえば、資本の蓄積過程におけるプロテスタンティズムのばあいのように、利害関心と理念の境界は、結局純粋に主観的なものにすぎないばあいが多い - p44, 存立構造 ... described as 資本の運動の受肉化 just reminds me of カルヴァン派. 神が彼らのうちに働き、それらが彼らの意識にのぼる、- つまり、かれらの行為が神の恩恵の働きによる信仰から生まれ、さらにその行為の正しさによって信仰がまた神の働きであることが証しされる、というわけなのだ - p183, プロテスタンティズムの倫理と資本主義の精神 And to the Weber's "homework", should I approach like this? 人間を現実に類的な存在たらしめるのは、このように静態的な、存在としての同類性でなく、実践における諸個人の現実の諸関係である。"類的本質"をこのように、諸個人の実践的な諸関係の総体性としてとらえかえしてはじめて、その関係の特定の現実的なあり方<本質>が疎外=物象化をもたらすという把握への道がひらかれ、したがって実践的には、その止揚への具体的な展望がきりひらかれうると同時に、他方また理論的には、その具体的・科学的な解明への道がひらかれる - p36, 存立構造
プロテスタンティズムの倫理と資本主義の精神 by Ryo
How Gatsby's attempt ... 夜な夜な繰り広げられる豪華なパーティの行為規範は、勤勉や努力といったフランクリン的な道徳とは食い違う。ギャッツビーがいかに情憬を抱いたとしても、生真面目なギャッツビーと気まぐれなデイジーは折り合うことはない。そして当然、前者の世界は後者の世界に負ける - p92, マックス・ウェーバー(野口雅弘) ... fits into a bigger picture. But I don't think Gatsby was aware of himself. ピュウリタニズムの人生観は近代の"経済人"の揺藍をまもったのだった。ピュウリタン自身も自覚していたように、富の"誘惑"のあまりにも強大な試練にたいしてまったくことは確実であった...これはまさしく、世俗内禁欲の先駆者、すなわち、中世修道院の禁欲がくりかえし陥ったのとまったく同じ運命であった...こうして宗教の形は残るけれども、精神は次第に消えていく - p354 How come Fitzgerald wrote such novel, if he really hadn't read the book haha. Wow. ウェーバーはもちろんフィッツジェラルドを読んでいないし、フィッツジェラルドもウェーバーを読んでいたわけではないだろう。しかし、ウェーバーが両親の相克から"二つの律法のはざま"を書いたように、フィッツジェラルドもギャッツビーとデイジーに託して相克する二つのビジョンの物語を書く。そして高度化する資本主義社会における空虚さに目を向けながら、かつての理想の喪失を語ろうとするとき、この二人の眼差しは交差する - p92, マックス・ウェーバー(野口雅弘) Another example of how things change. 王政的・封建的社会は、台頭してくる市民道徳と反権威的・禁欲的な私的集会に対抗して、"享楽意欲のある者"を保護したのだが、それは今日、資本主義社会が労働者の階級道徳と反権威的労働組合に対抗して"労働意欲のあるもの"を保護するのに似ている - p329 The way they seek 合目的な目的 ... 遊技はただ合目的な目的、つまり、肉体の活動力が必要とする休養に、役立つものでなければならなかった - p329 ... reminds another version of today's 合目的な目的. 余暇は労働力の再生産に必要な時間にすぎないのだから疎外された時間であるというだけでは不十分だ。余暇の疎外はもっと深刻な問題であり、余暇の労働時間への直接的従属に基づくのではなく、むしろ時間の浪費の不可能性そのものに結びついている - p266, 消費社会の神話と構造 This line is such a prophetic one. 市民的な生活のスタイルがもつこうした禁欲的基調を、ゲーテもまたその人生の高みから"ウィルヘルム・マイスターの遍歴時代"と、ファウストの生涯の終幕によって、われわれに教えようとしたのだった。かれにとって、この認識は、ゆたかで美しい人間性の時代からの断念を伴う、そうした袂別を意味した...禁欲は修道士の小部屋から職業生活のただ中に移されて、世俗内的道徳を支配しはじめるとともに、こんどは、非有機的・機械的生産の技術的・経済的条件に結びつけられて近代的経済秩序の、あの強力なコスモスを作りあげるのに力を貸すことになった...そして、このコスモスは現在、圧倒的な力をもって、その機構の中に入りこんでくる一切の諸個人の生活スタイルを決定しているし、おそらく将来も、化石化した燃料の最後の一片が燃え尽きるまで決定しつづけるだろう - p365 こうした文化の発展の最後に現れる"末人たち"にとっては、次の言葉が真理となるのではなかろうか。"精神のない専門人、心情のない享楽人。この無のものは、人間性のかつて達したことのない段階にまで登りつめた、と自惚れるだろう"と。 - p366 And this like just sounds like being spoken back from his time ... 読者はここでいま一度、この論考の冒頭で引用したフランクリンの小論を見直して...見とどけていただきたい - p362 ... leaving a homework, surely the most interesting one I have ever been given haha. 以上の素描でその一端にふれたにすぎない禁欲的合理主義の意義を...人文主義的合理主義とその生活理想や文化的影響に対する関係、さらには哲学上ならびに科学上の経験論の発展や技術の発展に対する、また精神的文化諸財に対する関係が分析されねばならないだろう - p368
自分が考える"大人" by Ryo
So here is what I consider 大人 that I have been referring to recently. Its not those 下司 ... サルトルが"下司"と呼んだ人々です。サルトルはこうした人々を、立派な社会人の典型とみなしていました - p256, 責任と判断 ... nor those who takes things for granted and have no understanding of how things are "as they are". 彼らは文明のもたらす種々の便益が、実は大変な努力と最新の注意によって辛うじて維持される素晴らしい創意工夫であることを見ようとはしない。そして自分たちの果たすべき役目は、あたかも持って生まれた権利であるかのように、それらを断固として要求するのみで事足りると思っている - p132, 大衆の反逆 I consider 大人 to be those people who understands, can discuss, and capable of applying to practical matters. これらの観念を用いるという実践的問題は、歴史的な見方を通して初めて理解も出来、論議もできるものなのです - P120, 歴史とは何か Given the definition, I'm getting more and more aware of how I have been unaware of 大変な努力, 繊細な注意 and 創意工夫. Its a process involving excitement of learning new things, and at the same time an obligatory one to be 大人.
How Gatsby came to, and ceased to exist by Ryo
I wonder if what is referred as 大衆的貧困の世界 by Galbraith is interchangeable with 伝統主義的精神 held among 資本主義以前の経済労働の基調. 近代資本主義が、人間労働の集約度を高めることによってその"生産性"を引き上げるという仕事を始めたとき、到るところでこのうえもなく頑強に妨害しつづけたのは、資本主義以前の経済労働のこうした基調だった - p65, プロテスタンティズムの倫理と資本主義の精神 If so, is 労働を自己目的化 した労働者 that an affluent society should assume for its economics? It does sound paradoxical, but can society being affluent(消費社会の神話の構造的な) get along with 労働の自己目的化, maybe for the below reason? 自らの足で立ち知性と理性を持ち、そして行動する市民社会の中の個人からなる消費者は、貧しい時代を背景にした通念にすぎないのである。"通念の敵は現実"であり、その現実は大衆社会である - p106, ガルブレイス - 資本主義との格闘 Even if does, I don't think we can't treat Benjamin Franklin kind of 近代資本主義的な精神(↔伝統主義的精神) the same as that of today's 近代資本主義的な精神. そうした"新しいスタイル"の起業家が醒めた自己抑制を維持し、経済上・道徳上の破滅に陥らぬためには、きわめて堅固な性格が必要であり、明晰な観察力と実行力とともに、とりわけ決然とした顕著な"倫理的"資質 ... そうした倫理的な資質が、過去の伝統主義に適合的なものとは異なった、独自なものである - p78, プロテスタンティズムの倫理と資本主義の精神 Maybe the comparison is what was depicted by the Great Gatsby. By the way, the description sounds exactly like Gatsby haha. Anyways, the fact that they are both 倒錯的 doesn't change. また他方、経済生活における新しい精神の貫徹という、外観上は目立たないが、しかしこうした決定的な転換を生み出したのは、通常、経済史上どの時代にも見られる命知らずな厚顔な投機家や冒険者たち、あるいは端的に"大富豪"などではなくて、むじろ厳格な生活のしつけのもとで成長し、厳密に市民的な物の見方と"原則"を身につけて熟慮と断行を兼ねそなえ、とりわけ醒めた目でまたたゆみなく綿密に、また徹底的に物事に打ちこんでいくような人々だったのだ - p78, プロテスタンティズムの倫理と資本主義の精神 After all, 合理性 is about making sense out of 論理, and the 論理 doesn't need to be 合理的. What's interested is how such 論理 came to exist, its 精神的系譜. 生活の"合理化"は、きわめてさまざまな究極的観点のもとに、きわめてさまざま方向に向かって行われるうるものなのだ。 - この簡単な事実はしばしば忘れられるけれども、"合理化"に関するすべての研究の冒頭におかれるべきことがらだろう。 - "合理主義"は一つの歴史的概念であり、そのなかに無数の矛盾を包含しているのであって、われわれの究明すべき点は、過去および現在において資本主義文化のもっとも特徴的な構成要素となっている"天職"思想と - 前にもみたとおり純粋に幸福主義的な利己心の立場からすればはなはだ非合理的な - 職業労働への献身とを生み出すに至った、あの"合理的"な思考と生活の具体的形態は、いったい、どんな精神的系譜に連なるものだったのか、という問題でなければならない ... この非合理的要素は、どこからきたのか、ということなのだ - p94, プロテスタンティズムの倫理と資本主義の精神
オセージ族の論理 by Ryo
オセージ族では祭式執行者が用いる毛皮靴を作るときには、複雑な儀礼が行われる。祈願の文を分析して、毛皮靴には単なる実用機能以上のものがあることを知っているのでなければ、服装の一要素のにこのような特別の配慮をするのはふしぎに思われるだろう。文化に帰属する物品である毛皮靴は、それを歩く者が踏み潰す"悪い"草に対立するのである。かくしてそれは、敵を粉砕する戦士に対応する。ところが、オセージ族の社会・宇宙論的図式では、戦士の役割は地の半族が伴っている。しかも地の半族には草も関連づけられている。毛皮靴だけの象徴性は、全体の象徴性を矛盾することになる - p169, 野性の思考 Its just another contradiction<論理的不安定性> within their logic<神話>, just like we have our own contradiction in our logic ... 社会的諸形象(商品・貨幣・資本・利子率・国家・官僚制・法・道徳、等々)と...<それらの>諸法則である。そしてこれらの法則を"運命"または"利益"として身にこうむる主体の生の現実性は、"文学"あるいは<実存>の哲学等々の主題として体系から疎外される - p24, 現代社会の存立構造 ... and they as well try to come up with a way to compromise<取り繕う> with their logic ... 製造品の論理的不安定性とでも呼ぶべき性質が明らかにされると、儀礼が丹念に行われるわけもわかる。高度に儀礼化された製造技術は、まさにこの不安定性を取り繕うためなのである - p169, 野性の思考 ... just like we do for our own ちょっと理解しえない logic. こうしたドア<詩・文学・教会>を全部叩いてみた者は、彼らをとにかくつなぎとめていた凍った理性が溶けていくのを見た - p23, アデン、アラビア And its about untangling<解明> this logic and becoming aware of myself ... 経済生活の全面を支配するにいたった今日の資本主義は、経済的淘汰によって、自分<資本主義>が必要とする経済主体 - 起業家と労働者 - を教育し、作り出していく...資本主義の特性に適合した生活態度や職業観念が"淘汰"によって選び出される...だからこそ、そうした職業観念の成立がまずもって解明されなければならないのだ - p52, プロテスタンティズムの倫理と資本主義の精神 ... and I believe the book is full of examples to build such respect<共感> and have better understanding on the world he/her lives. 同類に対する徹底した異化の作用と、異人に対するときの彼らの自意識をカッコに入れた共感の作用の対比、あるいは、異なった者への接近と近い者からの離脱の相反する方向のひとりの人間のなかでの交差、この独自の関係への感覚に...レヴィ=ストロースの人類学的思考のひとつのエッセンスがあると思われる - p118, 闘うレヴィ=ストロース
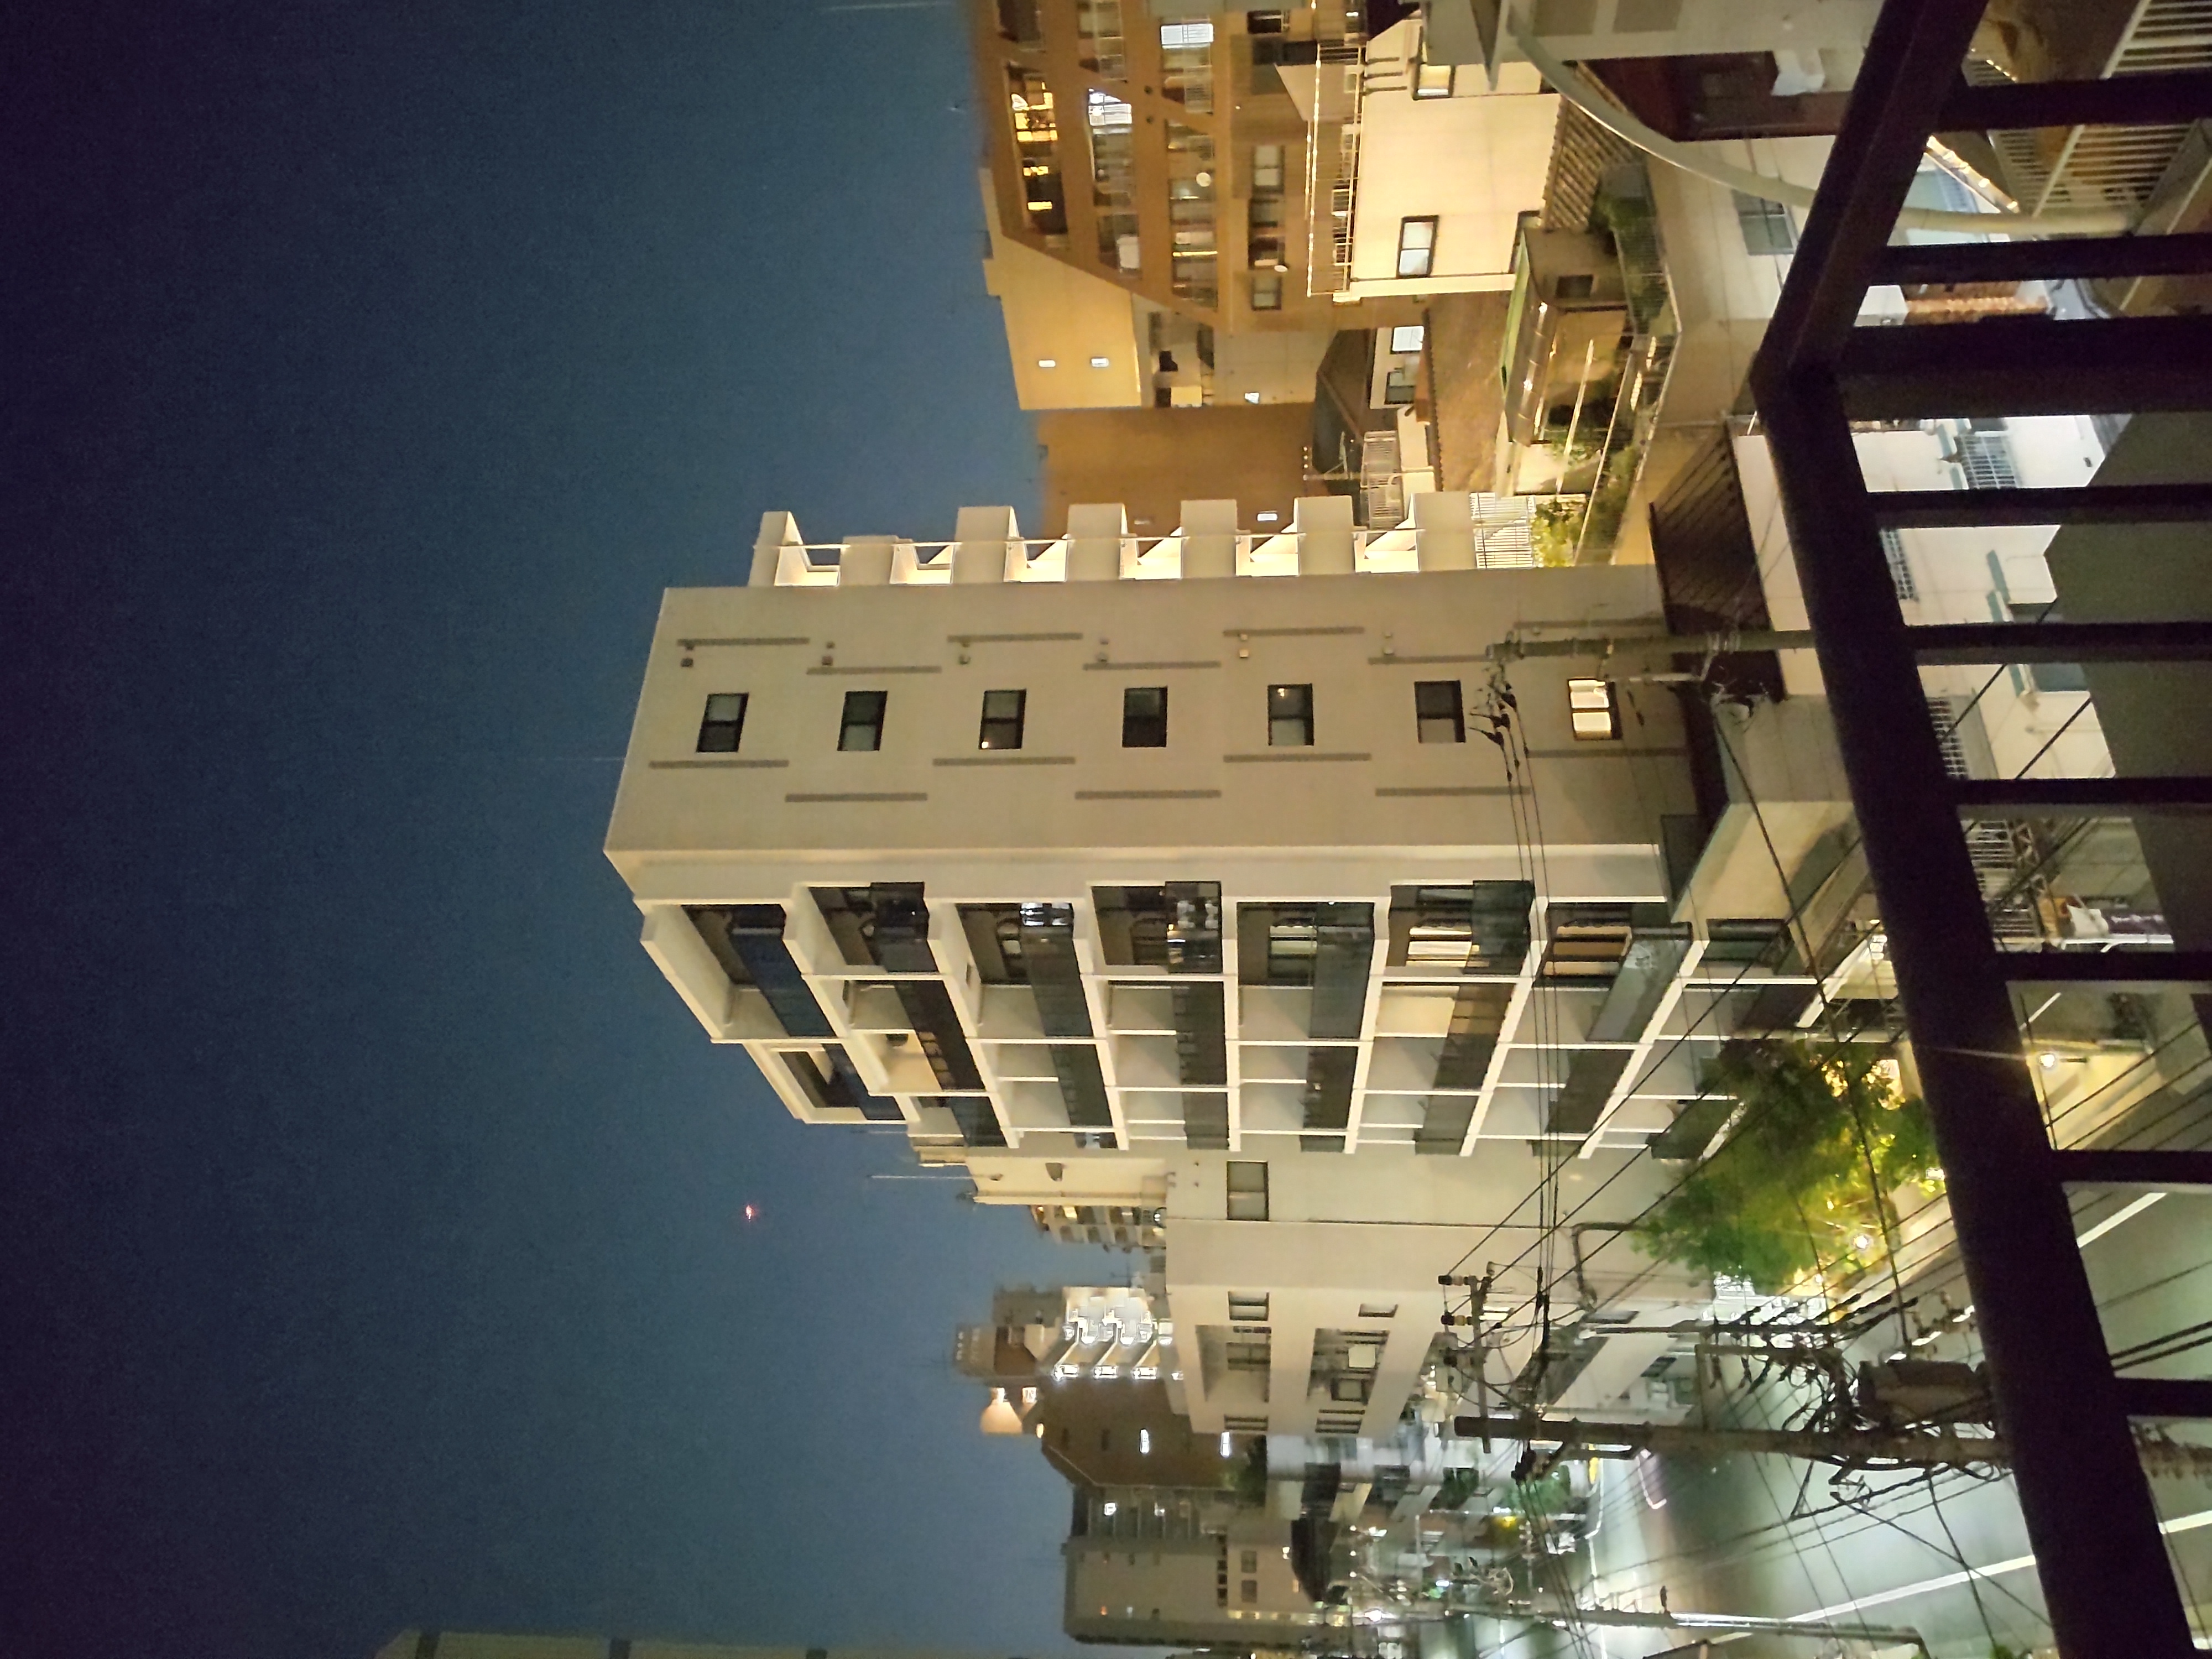
End of Summer by Ryo
Rooftop is my (secret😆)favorite place. The place during summer is great to chill.
I can feel its getting colder. And I sense that summer is ending, just so caught up in the moment.
Looking back my 26, I find myself still so confused haha.
Can't(yet?) imagine myself anywhere in the future.
 And don't know myself where all those books are leading to. It just seems like its the only thing left, and the least I can do for now.
Hope I'll figure out if there is anything out there that I can do something about it.
You know we got a mystery to solve, So, Scooby-Doo, be ready for your act.
And don't know myself where all those books are leading to. It just seems like its the only thing left, and the least I can do for now.
Hope I'll figure out if there is anything out there that I can do something about it.
You know we got a mystery to solve, So, Scooby-Doo, be ready for your act.
自分にとっての経済学 by Ryo
I do like to give a try in ... 理論の力というものがもしもあるとすれば、その力は何よりも、日常の意識における自明性の世界を解体し、そこにかくされた問題を発見すること...批判的に対自化し、実践的に止揚するための突破口をきりひらくことになるだろう - p23、社会の存立構造 ... rather than in 文学 or <実存>の哲学 ... これら<社会諸形象>の法則をその"運命"または"利益"として身にこうむる主体の生の現実性は、"文学"あるいは"実存"の哲学等々の主題としてその体系から疎外される..."科学"や"文学"の実践価がただ、情況の地平のうちに内在する"公的"なあるいは"私的"な、"実用的"なあるいは"倫理的"な諸実践にとっての媒介にとどまるか、あるいはいっそう端的に"教養"(自己疎外的精神!<?>)としてとどまるということは、すでにその立脚する問題のたて方によってあらかじめ宿命づけられている - p25、社会の存立構造 ... as for such destined nature, also people depicted by Paul Nizan seems have already tried, so did I. 逃げ道ならいくらでもあった。どこにも行き着かないドアならいくらでも...暇な彼らは、依然として詩と名づけられていた偽りの純粋さのぞっとするような状態のなかに生きていたのだけれども、単に病のなかにはまりこんでいただけで、その病の理由を見つめようともしなかった...人間の最後の名誉のために、あの詩人たちがへんに疑念など感じたりしませんように。 - p21、アデン、アラビア こうしてドアを全部叩いてみたものは、彼らをとにかくつなぎとめていた凍った理性が溶けていくのをみた。読んだ本や幼いころみんなでやった遊びを思い出しながら、彼らは突如思いついたのだ。旅をしようと... - p23、アデン、アラビア And the reason for me to learn economics, is not for its practical use, but for what referred as 唯物論に対立して抽象的に観念論によって展開されることになった能動的な側面 ... これまでのあらやる唯物論の主要欠陥は、対象、現実、感性がただの客体の、または観照の形式のもとでのみとらえられて、感性的人間的な活動・実践として、主体的にとらえられないことである。それゆえ、能動的な側面は、唯物論に対立して抽象的に観念論によって展開されることになった - p26、社会の存立構造 ... as what I care the most is its<分析理性的な経済学> complementary leftover<補完物>. I think its this complementary leftover is what I think people seeked for in all those 文学, 哲学, or 旅. ここでは、人間的な活動・実践の対象物として物象化して観照する分析理性の方法が必然的に、その補完物として、人間それ自体にかんする観念的な神秘化を要請する - p26、社会の存立構造 Its about the question<問題の立て方> you ask to yourself ... <物象化された>事物から出発し"事物に仕える"分析理性の社会諸科学とは逆に、弁証法的な理性は、物象化の過程をまず問題として主題化すること、すなわち"事物"たる社会諸形象・諸法則の存立の根拠そのものを問うことをみずからに課する。"法則を概念的に把握すること。""事実そのものを解明すること。"これらの表現において青年マルクスが要求したのは、まさにこのことに他ならない - p27、社会の存立構造 ... and here literally means "yourself" haha. 疎外された主体性としての"実存"の主観的な表出としての"人間の哲学" - p28、社会の存立構造 By the way, I once again started reading Orientalism. I wonder what led them to Asia, why and how they came to seek 人生に対する信頼感 in Asia. ... 彼らは方位の示す針に最後のチャンスがひっかかっているように思えるところに飛んでいった。冒険という口実が、とにかく捨てきれずに持っていた人生に対する信頼感を保証してくれた...ヨーロッパ旅行はなしだ。僕たちはアジアから生えた芽であるこの幅の狭い土地を、ひとかたまりとして僕たちの故郷として見なすようになっていた。ひとは、逃れられないただひとつの運命という不幸を背負った唯一無二の存在としてヨーロッパのことを語った...まさにこのヨーロッパから僕たちは自由にならなければならなかった - p23, アデン、アラビア
存立構造 by Ryo
諸個人が媒介的・即自的に社会的存在である場合<集合態> 諸個人の生が、この原生的な共同体のきずなから解放され、反省的な意識の主体として確立するが、みずからの生の物質的・精神的な内実を決定している社会的連関の総体性を、結合的な実践において対自的に統御することはできず、したがって諸個人は"私"的にのみ主体的であり、それら多数の、相互に外的な私的実践の相互干渉の全体系が、結果的に諸個人の意思から独立した諸法則を貫徹せしめる - p19, 現代社会の存立構造 諸個人が対自的に社会的な存在である場合<対自的な共同態> 諸個人が個として自覚的・主体的であるのみならず、その生の物質的・精神的な内実を決定する彼ら相互の連関の総体性をも、自覚的に統御する共同体的な実践の主体としてある..."社会"がもはや、諸個人にとって疎遠な対象的実在であることをやめ、ふたたび諸個人の主体的意識のうちに透明に存立する - p20, 現代社会の存立構造 <集合態>の内部に...<対自的な共同態>の関係が胚胎していたり - p20, 現代社会の存立構造 Does it mean that the world used be more of 対自的共同体 back then, and its getting more of 集合態的? Or has it always been the same ever since, me just too submerged by such aspect I see in today's world? この本は、当時日本で、社会をその原理的な水準から理解しようとしていたすべての人、とりわけ若い読者に強い衝撃を与えた..."資本論"に書かれていることは、"経済学"以上のことである。"資本論"は、経済現象の分析を通じて、潜在的には、権力現象(政治)や意識現象(文化)についても論じているのだ。その潜在的な部分を掘り起こし、明晰化しているのが、"存立構造"である - P13, "現代社会の存立構造"を読む It reminds me of this line. Or it could be me just totally misunderstanding what is meant at first place haha. 構造主義のメリットと限界というのは、第一の記号学が、その構造分析において単なる解明・記述の道具にとどまらず、第二の言語学の乗り越えの方向を有するか否か、という問題とも深く関わっている。換言すれば、構造のもつ拘束性そのもののなかに自らを突き崩し変革する反構造的契機を見出していかない限り、構造分析は文字通り分析的思考の枠のなかで硬直し、構造維持もしくは構造強化の役割をはたしてしまって、弁証法的思考への途はいつまでも閉ざされてしまうであろう - p294, ソシュールを読む 市場(=個人の自己獲得、対・社会存在化が行われる)を通して獲得される"自己"は、当人からは疎外されている皮肉な逆説。自己の疎外が生じる市民社会的な社会(集合態)の成立を、私的所有や商品の貨幣関係に求めるのが資本論、みたいな? <内・社会存在>から<対・社会存在>へ、人間たちのこのあらたな自己獲得の地平は...この間接的な意味の回路をみずからの他在(=社会・市場)のうちに、自己自身にとってよそよそしい対立者の手中に疎外する構造をもつという意味で、同時に固有の自己疎外への転回を胚胎する地平でもある - 103頁, 現代社会の存立構造 I'll see!
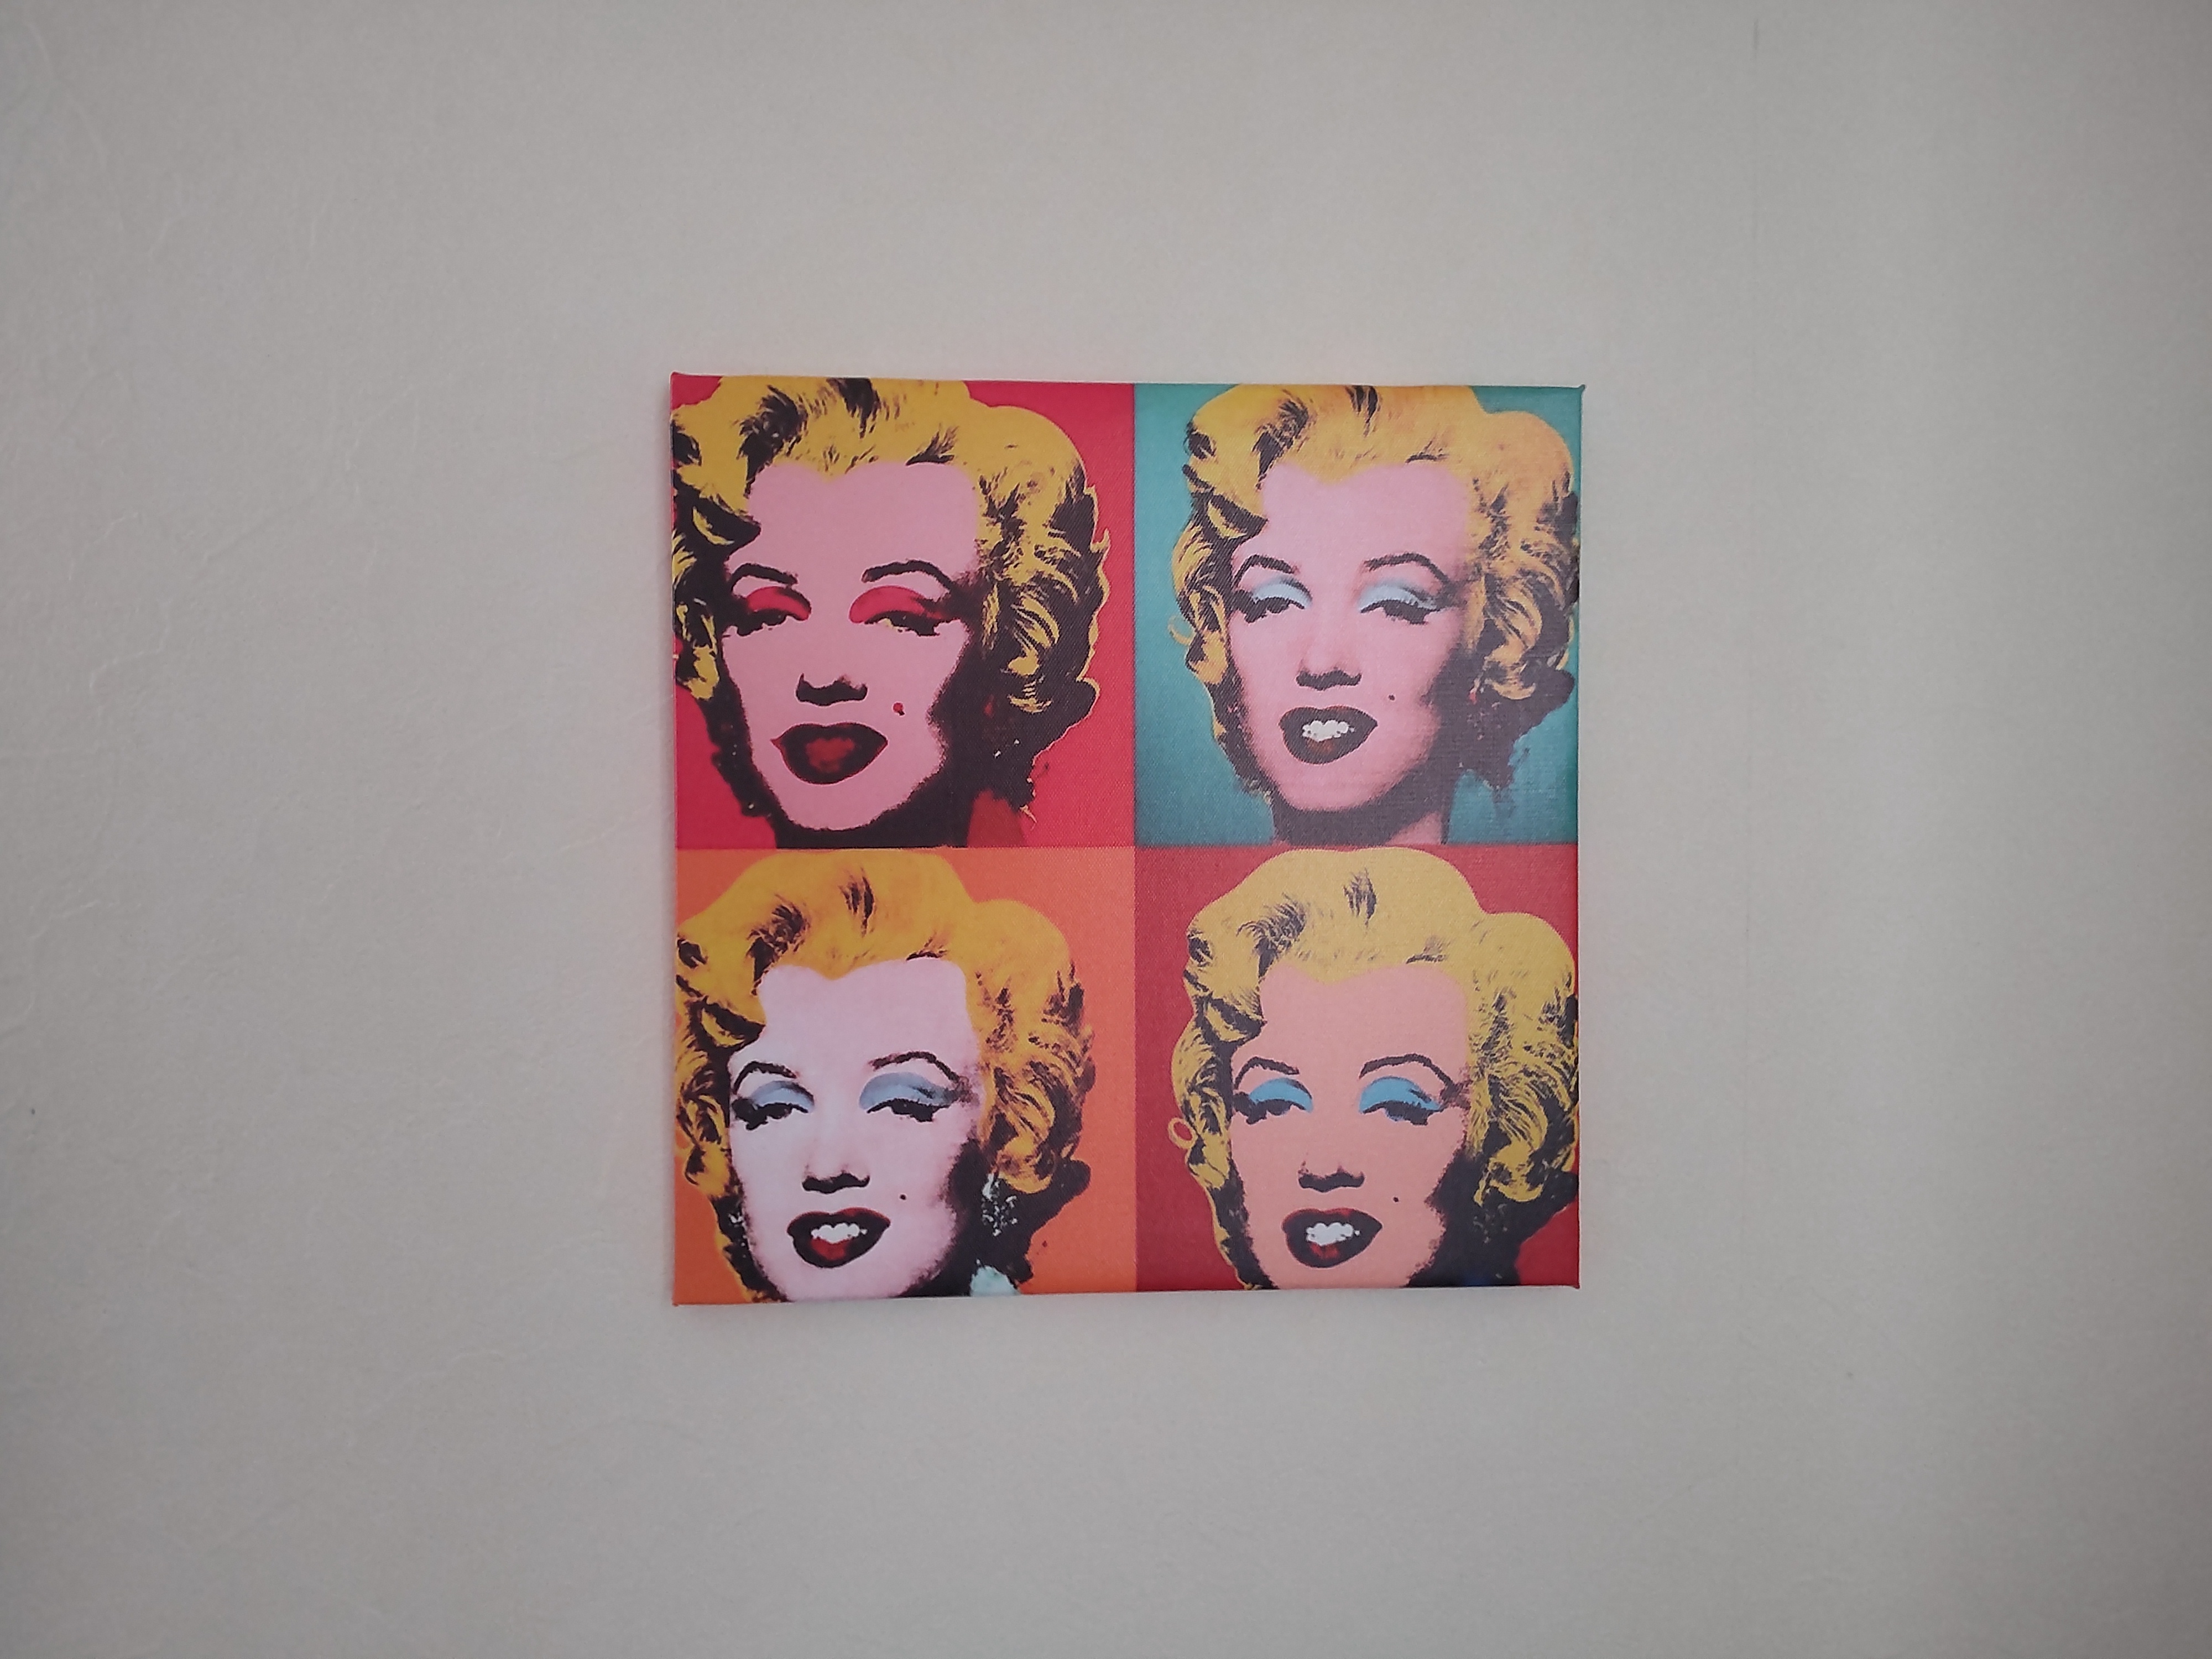
Marilyn Diptych by Ryo
I'm not really sure what's there to value those copies of original, maybe for the reason below (also because of my lacking aptitude in art) ... 過去の絵画は作品に表れた才能の輝きと超越性にもかかわらず署名入りの(記号としての)モノであったし、署名の力によって商品化されえたのだが ... but Pop Art could be different. これとは反対にポップ・アートは絵画の対象とモノとしての絵画を和解させる - p190, 消費社会の神話と構造 How Pop Art retains its value, unlike those traditional ones, sounds paradoxical but it does make sense, given how they came exist and persist to exist. And I think I may be appreciate its value because for the very reason that its value actually makes sense, not really because of its artistry (like I said I lack aptitude in art haha). 筋が通っているといおうか、それとも逆説的というべきだろうか。モノへの偏愛とか"商標付きの"モノや食料品の際限のない形象化を通して"署名入り"の"消費される"モノとしての芸術という独自の地位を追求した芸術がポップなのである - p190, 消費社会の神話と構造 It remind me of such time and world I ended(ing) up. ポップアーティストたちのつくるモノは...自分を巻き込んでいるこの<消費社会の>神話以外には伝えるべき真理をもたない...すなわちモノと製品の真の姿はそれらにつけられたマーク<記号としての機能>だということに他ならない...モノはこの神話的言説を完成させ、自分自身もそこに入りこむことぐらいしかできないのだ - p189, 消費社会の神話と構造 Maybe I should hang one in my room, in an attempt to prevent it from to getting sacralized. ポップ・アートが呪われた芸術となり、聖なる機能を再び授けられるようなことにでもなれば、最悪の事態というべきかもしれない - p189, 消費社会の神話と構造 I wonder if anyone of Year 3000 would look back and say I was such 時代精神 of 20xx haha. There might no longer be 内在的秩序 for the painting to 同化, we'll see. That's it for today's post!
アデン、アラビア by Ryo
大人たちのなかに入ること。この世界のなかで自分の居場所を知るのはキツイものだ...それが成長することだって信じさせたいのだろうけど、こんな生活が終わることはないのはわかっている...自分たちの感じている恐れや隷属の根が、工場や銀行や兵舎や警察署といったまったく見知らぬ世界のなかにあることがどうしてわかっただろう...誰もが自分のやり方で脱出を確実にしたいと思うものなのだ...逃げ道ならいくらでもあった。どこにも行き着かないドアならいくらでも - p19 この機械を動かす法則、その原動力の源を理解することは、あてどなく幾度かさまよい歩いたあと、人間だけがそこに向かって歩むことのできる目標が、なんとなか見えてきた若者の目にはきわめて大切なことのように思われる - p71 アデンの住人たちはロンドンとパリの住人のように - しかもみんな成長するのにちょうどよい温度の温室の同じ植物なのだ - 現われ、立ち止まり、歩き、泣き、消え、これといった理由もなくいなくなる...彼らの意志の対象は実在していなかった。それは擬人化して語らせることさえできない抽象的な本質、つまり貸借対照表とか収支とか融資とか資本の循環とか商業的成功とか職業上の義務といったものなのだ...彼らは抽象的だった治癒不可能な悪徳がひそかに命じるところに従うように、人間とは関係のないあらゆる命令を実行していた。にもかかわらず彼らは言っていた。"何はともあれ人生さ"と。 - p77 僕は何度人間という言葉を繰り返すのだろう。ほかの言葉を与えてほしい。問題はこういうことだ。人間という言葉のなかに何があるのか、そして何がないのかをはっきり述べること...人間が真の人間のように、たとえば歴史や詩のなかで語られる者たちのように不透明であることを妨げているものが何かあるのだと思う - p79 熱帯の砂漠にこんな当たり前の事実を発掘しに来る必要が、アデンまでパリの秘密を探しに来る必要があったのだろうか?帰国したとき、ほかの多くの人たちが、セーヌ川のまんなかをこうした真実が通り過ぎていくのを見ていたことを知った...そうした真実を若さゆえの過ちだと見なすことはできなかった。成長がすべてを説明するなんて言われてももう信じない。こうした真実にパリ五区の壁のあいだで出会えたという可能性はやはり低かったように思われる - p98 旅にまっとうなものはひとつしかない。それは人間に向かって進んでいくものだ。それがオデュッセウスの旅なのだ。僕が無駄に古典の勉強をしていたのでなかったのなら、そんなことはわかっていて当然だったのに。そしてこの旅はもちろん帰還することで終わる...人間というものを理解したと思ったとき、僕の頭の中には帰ることしかなかった - p104 二十歳のポール・ニザンに批判されないような大人になれたら、その時には旅したい。
プロテスタンティズムの倫理と資本主義の精神 by Ryo
Here is what I thought this morning how the book should be read. Keeping in mind how the ethic of protestantism and those found in today's society ... ピューリタンは自分自身の人格を、神を最大限に讃えるために利益を生ませるべき企てとみなしていた...それとは反対に、しかし同じやり方で、消費する人間は自分自身を享受を義務付けられた存在として、享受と満足の企てとしてみなすのである - p116, 消費社会の神話と構造 ... leads to the spirit of capitalism, the very nature in regards are the same as pointed out. だが、この交代が人間的な革命であるというのは見かけだけである - p120,消費社会の神話と構造 And such nature prevailing everywhere ... ウェーバーが近代資本主義的生産至上主義の基礎にあるとした合理的で厳格な規律主義の倫理がこうしてこれまでそれを免れていた一台領域を占拠する - p119, 消費社会の神話と構造 ... is what was depicted in Aden Arabie by Paul Nizan ... ポール・ニザンは、文明の、そして取り返しのつかないまでに損なわれた精神の形の、その当時の居心地の悪さ、不安、嫌悪を描き出している。倦怠と不安は急速に高まり、ある日、彼自身もはっきりとした理由もなく、偶然提示された勤め口を受け入れて、フランスを離れるというほどにまでになるのだ。アデンへの旅である。しかし、この大地の新しい地方で、彼は離れてきたもの以外の何物にも出会わない。こうして彼は世界の呪いが、誰か特定の人間や、特定の文化的遺産や、特定の空に由来するのではなく、パリでは一度も気がつかなかったが、アフリカの海岸では突然あらわになる何かに由来することを理解する - なぜならそれはまさにあちらとこちらで似通ったものだから。すなわち資本主義こそが責められるべきなのだ - 1931, Lévi-Strauss ... and what was being criticized by Lévi-Strauss. 文明世界が自分以外の世界すなわち植民地を支配しようとして作り出した関係の構造が、文明世界そのもののなかに凝縮されたのが世界大戦であり、それによってもたらされた"ある種の国際的内戦"の解決には、世界全体として支配の構造を解体せねばならない。これが、国際的内戦の時代にかろうじて世界の余白に自分たちの宇宙を維持し生活を営んでいた人々を見届け、そこに侵食するデフォルメされた文明世界の背後に、自分のよってきたる文明の退廃を透視するというレヴィ=ストロースが獲得した同時代世界の遠近法だった - p121, 闘うレヴィ=ストロース Maybe the book should better be read along Aden Arabie. It just makes me want to get out, and see the world by myself.
何気ない日常の"読み"方 by Ryo
第一の"読み"はコトバの生み出した歴史・社会という人間文化の解明であり、日常的にあまりにも自明であるとされ誰一人疑いの眼を向けない文化現象を根底から疑い、これを徹底的に読み直す。つまり読む対象としてのテクストは、私たちがその中で生きている日常現実であり、記号の跳梁跋扈(ちょうりょうばっこ)する世界である。その"読み"の目的は、もはやモノに反応することを忘れて記号・象徴の生み出す<像=世界>の意味にのみ反応せざるを得なくなっている<象徴を操る動物>の解明であり、人為・制度が作りだした擬似自然の正体を徹底的に暴くことの何ものでもない - p293, ソシュールを読む I believe the above process will just ends up as what is suggested below ... 構造主義のメリットと限界というのは、第一の記号学が、その構造分析において単なる解明・記述の道具にとどまらず、第二の言語学の乗り越えの方向を有するか否か、という問題とも深く関わっている。換言すれば、構造のもつ拘束性そのもののなかに自らを突き崩し変革する反構造的契機を見出していかない限り、構造分析は文字通り分析的思考の枠のなかで硬直し、構造維持もしくは構造強化の役割をはたしてしまって、弁証法的思考への途はいつまでも閉ざされてしまうであろう - p294, ソシュールを読む ... which I believe can be rephrased as 自らの相対化<文化におけるパロール活動>を通して、自らの世界を開き直す作業. オルテガの言う通り、自己懐疑の回路を自らの科学・合理主義によって閉ざされてしまった知識人こそ、まさにこうした大衆なのである - p302, ソシュールを読む I think what the book discusses was just what I needed to resume reading 消費社会の神話と構造. Also I think such books like 野性の思考 is exactly what referred as 自らの文化を相対化さえる作業 in p324. And I'm starting to think its in the process of opening up the world where you realize how everyday life is full of awaiting discoveries. As always, it just reminds of how plenty still there are for me to learn!
記号学 by Ryo
It reminds me ... 記号は自らの内在的な価値によってではなく、ちょうどチェスゲームのように、自らが占める相対的位置によって働いているのだ...それは、文化(歴史・社会現象)を非自然的、関係的な世界と見る視点...自らが作り出した記号の世界の恣意性、共同幻想性、相対性に気づいていないからこそ、この解明と乗り越えのための記号学が提唱されたのです - p132, ソシュールを読む ... of these line. パワーズという作家の大きな特徴は、世界を思い描く上で、意味づける自分と意味づけられる対象、自己と他者、という非対称的な関係をその根底に据えるのではなく、自分と対象との関係がまずあって、こくこくと変化していくその関係から、そのつど自分と対象とが分泌されていく、というふうに捉えていることである - p180, アメリカ文学のレッスン ルーマンのオートポイエーシスの理論は...人間の意識的な統御の及ばないかたちでコミュニケーションは次々と接続され、自律的に秩序を形成していく - p552, 社会学史 I believe 野性の思考, 言葉と物, et cetera, are about what's being referred as 恣意性、共同幻想性、相対性 or 言語の本質. ソシュールにとっては、言語は社会的産物であると同時に歴史的産物以外の何物でもありません。つまりは全くの人為であり、共同幻想としての恣意的価値体系なのです。だからこそ、すでに述べたように、言語や文化は、それが歴史的なものであればあるほど、十九世紀的な歴史学の方法を用いてはならず、それが社会的なものであればあるほど、デュルケーム的実証主義社会学の方法では解明されない、という逆説が生まれます。これは、記号学にやってしかその本質を捉えることができないものなのでした - p177, ソシュールを読む Such an interesting study!
レヴィ=ストロース by Ryo
ブラジルに出発する前後の20代のレヴィ=ストロースをやや詳しく振り返ることで、同時代の自分の世界への違和感と、ブラジルで出会った人々へのある共感を、構造主義以前の構造主義の感覚として確認することは大事な作業だと思われた - p256, 闘うレヴィ=ストロース デュルケーム社会学は実際、古典経済学が犯した誤り、そしてその除去こそがマルクス主義の歴史的存在意義である誤りを、社会の平面で実現している。古典経済学は、偶然的なカテゴリーである"社会"を普遍的なカテゴリーにかさ上げした。"社会"に資本主義社会を見たマルクスはそれを歴史のなかに位置づけ直すことで、"社会"がそれ以外のすべてを説明するのではなく、社会以外のすべてが"社会"を説明するということを証明した - 1931, Lévi-Strauss when 22 yr レヴィ=ストロースの植民地体制への関心は、国際秩序への関心という水準を離れて、世界のリアリティとしての"異なった世界"への関心に急速に変貌したように見える。そのきっかけは、ニザンの言葉に励まされた民俗学への関心であり、おそらくニザンが描いてみせたアデン・アラビアの現実だったのではないだろうか - p64, 闘うレヴィ=ストロース ポール・ニザンは、文明の、そして取り返しのつかないまでに損なわれた精神の形の、その当時の居心地の悪さ、不安、嫌悪を描き出している。倦怠と不安は急速に高まり、ある日、彼自身もはっきりとした理由もなく、偶然提示された勤め口を受け入れて、フランスを離れるというほどにまでになるのだ。アデンへの旅である。しかし、この大地の新しい地方で、彼は離れてきたもの以外の何物にも出会わない。こうして彼は世界の呪いが、誰か特定の人間や、特定の文化的遺産や、特定の空に由来するのではなく、パリでは一度も気がつかなかったが、アフリカの海岸では突然あらわになる何かに由来することを理解する - なぜならそれはまさにあちらとこちらで似通ったものだから。すなわち資本主義こそが責められるべきなのだ - 1931, Lévi-Strauss when 22 yr 25歳のときの文章での冷静なスタンスは興味深い...フロイトについて次のように述べて評をしめくくっている - p75, 闘うレヴィ=ストロース しばしばフロイトにおいては思考が経験の枠を越えてはみ出し、学理的な構築が忍耐強い基礎データの収集に先行している...逆に今日の精神分析家では反対の現象に立ち会わされる...近年の医師たちによって蓄積された大量の記録と成果について、検討を深め、射程と意味を明かにし、総合をおこなわなければならない。精神分析は再びひとりの哲学者を必要としている - Lévi-Strauss when 25 yr 文明世界が自分以外の世界すなわち植民地を支配しようとして作り出した関係の構造が、文明世界そのもののなかに凝縮されたのが世界大戦であり、それによってもたらされた"ある種の国際的内戦"の解決には、世界全体として支配の構造を解体せねばならない。これが、国際的内戦の時代にかろうじて世界の余白に自分たちの宇宙を維持し生活を営んでいた人々を見届け、そこに侵食するデフォルメされた文明世界の背後に、自分のよってきたる文明の退廃を透視するというレヴィ=ストロースが獲得した同時代世界の遠近法だった。それでは、"彼ら"はどのような"今"を生きているのか。それがレヴィ=ストロースにとっての人類学の固有の問いとなった - p121, 闘うレヴィ=ストロース ここまで賢くて、鋭い人が世界と向き合って「人生退屈しない」と言ったらしい。 退屈に感じることがあれば、それは勉強すべきことがまだまだあるということだと思う! By the way, what he wrote on Freud when he was 25 reminds me of this line. And those work of 哲学者 are the ones fascinating and exciting. マルクス、スペンサー、ヴェーバーらの仕事と、抽象的経験主義者の仕事を比較してみれば、すぐにそれがわかる。おそらく、"関係"という言葉の意味によるのであり、ラザースフェルドの場合は統計的な相関関係に限定されている - p112, 社会学的想像力
ECON 101 by Ryo
I'm starting to think econ is an quite interesting study, how all those math are taking 人間観/観念 into account, or rather should be said based on. Say Galbraith whose work is based against 人間観 of 消費者主権 ... 経済学のテキストブックが重視する消費者主権 - 自らの足で立ち知性と理性を持ち、そして行動する市民社会の中の個人からなる消費者は、貧しい時代を背景にした通念にすぎないのである。"通念の的は現実"であり、その現実は大衆社会である。知性と理性を持ち自立した個人が作り上げる社会は、西欧知識人の理想の中にあるものであった - p106, ガルブレイス - アメリカ資本主義との格闘 ... as Galbraith points out. Its is based on such notion established back in 貧しい時代. 世界のこの恵まれた地域の人びとがその生活を解釈し、その行動を律するのに用いる考え方は、裕福な世界にうまれたものではない。この考え方を生み出した世界では、貧困がいつも人間につきまとい、そうでない状況は考えられないというほどであった...十九世紀のはじめには、自分の欲しいものが何であるかを広告屋に教えてもらう必要のある人はいなかったであろう - p15, ゆたかな社会 And here goes against 人間観(個人) itself ... 欲望の形態変化という事態を「依存効果」という概念においてとらえ、自律的な個人の欲望が疎外されていることを批判的に検討したのがガルブレイス、J. K. である。これに対しボードリヤール、J. は自律的な欲望の主体が存在するという想定こそがフィクション――消費社会の「神話」――であると指摘し、このような疎外論的な問題構成の相対化を行った。そしてシステム論的な視点から消費の構造論的な分析を行い、「主体の問題系」から「記号の問題系」へと問題構成の場を移動させた - 現代社会学事典 ... as Baudrillard criticizes Galbraith. 消費者の"幸福で何ごとにも無頓着な"性質に訴えて、責任をシステムに機械的に転嫁するのはあまりにも安易なやり方である...彼は個人をシステムのまったくの受動的な犠牲者として登場させざるをえなかった - p105, 消費社会の神話と構造 Given what Galbraith states in the book, I wonder such shift from Galbraith to Baudrillard can be considered as 事実の進行, or is it just another 観念? 通念の敵は観念ではなくて事実の進行である。通念は世界を解釈するためのものであるはずなのに、前にも述べたように、通念はそうした世界に適応するのではなくて、聴衆の世界観に適応する - p29, ゆたかな社会
社会的事実 by Ryo
消費行動は、実は欲望の隠喩的な遠回しの表現、差異表示記号を通じた価値の社会的コードの生産といった他の目的に対応している。したがって、決定的な力をもつのはモノの集まりを貫く利害関心という個人の機能ではなくて、記号の集まりを通しての諸価値の交換・伝達・分配という直接的に社会的な機能である...消費の社会的機能と組織構造が個人のレベルをはるかに越えた無意識的な社会的強制として個人に押し付けられるという事実の上にこそ... - p113, 消費社会の神話と構造 Given the above, it uses the term 社会的事実. この意味で、消費は、言語や未開人の親族体系と同じように意味作用の秩序なのである。ここでレヴィ・ストロース的原則をふたたび取り上げることにしよう。消費に社会的事実としての性格を与えるのは... - p114, 消費社会の神話と構造 I wasn't really paying attention to the term at first, but it I found how its described in 社会学的方法の基準 well fits in the above context. I emphasize the part "この実在性は客観的であることをやめるわけではない". 社会の内に、他の自然諸科学が研究する現象から際立った特徴をによってきっぱりと区別される特定の現象群が存在する...<社会的な>義務が私個人の感情に合致し、またこれらの義務の実在性が私の心の内に感じられる時でさえ、この実在性は客観的であることをやめるわけではない...個々人の意識の外部に存在するという顕著な属性を示す行為、思考および感覚の様式...ここに非常に特殊な性質を示す一群の事実が存在する... - p53, 社会学的方法の基準 But I think I'm missing what is pointed out by この意味で, where its referring to the work of Claude Lévi-Strauss. Maybe I should take a look into his work, I'm curious what is meant by 同じように. Also I can see the book is apply a lot of 記号論, and why. 私たち人間は、文化現実を"客体的真の自然、絶対的実体"と信じ込み、自らが作り出した記号の世界の恣意性、共同幻想性、相対性に気づいていないからこそ、この解明と乗り越えのための記号学が提唱されたのです。だからこそ、この記号学的還元の目指すところは...その本質である形相性、恣意性を暴き出し、価値の相対性という認識に達することに他ならないのです - p65, ソシュールを読む Like below line ... モノと欲求はこの場合ヒステリー性のまたは心身相関的転換の兆候を同様、交換可能である。それらは地滑り、転移、恣意的にさえみえるか限りのない可変性といった同一の倫理に従っている...徴候は記号と同様、相対的に恣意的である - p111,消費社会の神話と構造 ... reminds me of this line. But I still don't fully get what its meant by, and not sure if its discussing the same matter. Maybe I need to sit down and read more carefully. 諸価値は、その絆が完全に恣意的なるが故に、全く相対的である...恣意性は価値の相対性の帰結ではなく、その原因です - p65, ソシュールを読む Its just that I can see how discussion can be based on one another. I feel its necessary come back and forth once I have a better understanding on the matter. --- Added as of 2025/08/20 --- I think I'll read ゆたかな社会 as well before going back to 消費社会の神話と構造. Besides the reason mentioned earlier, it has only has been a week since I got back from America and thought better read it now than in a distance future. I think I know what he meant by below. かれらは、かれらに与えられているものが奇妙にもちぐはぐであることを漠然と考えるかもしれない。はたしてこれがアメリカの特質なのだろうか - p10 These two to keep in mind while read the book. - 本書で述べている通り、現実の世界では、欲望をつくりだす手だてが生産の過程に内蔵されている - p5 - われわれの経済学的態度<自由主義、消費者主権?>がいかに過去の貧困、不平等、経済危機に根ざしたものであるか - p15
アルゼンチン旅行 '25 by Ryo
So I'm on somewhere above South America, back to the U.S. finished reading 社会学史. The book was great, as well as the trip which I will be writing about it later. The book gives you the overview of sociology, and it was just what I was expecting as I wanted to know about the kind of books I read and where my interest lies. Also it gave me some of topics and books that I didn't know about, and I'm thinking of looking into some of them. The first book is "客観性"論文, just because I like Weber. The second book is 現実の社会的構成―知識社会学論考, because 知識社会学 sounded interesting.
現実は、人間が解釈したり、意味を付与したりしなければ、現実にならない。ということは、社会的現実とは、人間の知識に媒介された構築物だということになります。このような現実の理解に立脚しているのが、バーガーとルックマンの"知識社会学"です - p455, 社会学史
Also for the reason where it says its a good introduction for those starting sociology, as I think I'm starting to enjoy sociology. It opens up the world a lot, and I'm excited about the world yet to be seen!
この本がとてもよい点は、まず、社会学理論や社会学史の勉強になるということです。いろんな学者の理論が出てきて、それらが、バーガーとルックマンの構図の中に、それぞれ位置づけられる。別の言い方をすれば、二人の構図は、さまざまな重要な社会学者の理論の張り合わせになっている - p456, 社会学史
The third book is 野性の思考. Its the same reason why I want to read 言葉と物 and 監獄の誕生.
当時支配的だった実存主義とマルクス主義 - とりわけ前者 - に対する解毒的な効果をもったということだと思います - p572, 社会学史
With that all being said, the last chapter on Structuralism was the most interesting I found among the all. It was mainly about Foucault and Luhmann. Maybe because I was interested in the subject back in my college days at first place for the reason ...
人間は、いまや"波打ち際の砂の顔のように消え去ろうとしている"という有名な句で、この本<言葉と物>を閉じています。このように書くとき、フーコーは、実存主義、とりわけサルトルの実存主義に引導を渡そうとしているのです - p578, 社会学史
... but I think its also because these days I'm interested in what is meant to be said by below.
Non ridere, non ligere, neque detestari, sed intelligere - スピノザ
Or in other words, if I understand correctly, can rephrased as below.
ルーマンの相対主義は、実践的には何を含意するのか。何もしない、というのが答えです。社会学ができることができることは、事態を記述すること - p566, 社会学史
Other than the reasons above, I'm interested in the book's approach of how it examines cases where we can find trace of エピステーメー. The book share examples of ラス・メニーナス and ドン・キホーテ, and I expect there to be more of such studies. Also, I leaned that there is a prison in Argentina which was designed to follow the logic of パノプティコン discussed in 監獄の誕生. May be I will visit the place if I get to visit Argentina for the next time haha.
Regarding Luhmann, I didn't know anything about him. But as the book suggests, how his theory gets along with Faucaut's sounds quite interesting ...
誰かの意識的な設計とか、意識的な計算とかには回収できない。そこにこそ、構造というもののふしぎがあるわけです - p519, 社会学史
... where it touches 構造主義のふしぎ just like how Faucault does, but in a different way.
ルーマンのオートポイエーシスの理論は...人間の意識的な統御の及ばない形でコミュニケーションは次々と接続され、自律的に形成していく...(構造主義の意味での)構造の生成の論理につながりうるものがある、と解釈できるのではないでしょうか - p552, 社会学史
Also, the discussion between Habermas and Luhmann ...
社会はそれ自体、社会の自己観察の産物として実在するというわけです...あらゆる社会にも通用する普遍的な真理などない、ということになります。どんなシステムにも成り立つような道徳的命題とか、正義という観念もここからは、出てこない...それぞれのシステムに相関かっこつきの真理や正義だけをみとめる、徹底した相対主義です。そうするとハーバーマスとの論争の意味もわかってきます...近代が未完だとされたのは...まさに現状を"未完"として位置づける完成した近代が、理想的な極点に想定されている。その極点には、普遍的な正義や真理が待っているのです - p566, 社会学史
... just reminds the discussion between Sartre and Foucault on 主体性, which also I think is quite interesting. Maybe I should take a look at 批判理論と社会システム理論 in regards. Related to the discussion so far, I remember Kant saying something about how our perception is limited by 理性. Its quite interesting how his discussion can be associated with those two. 純粋理性批判 might be interested to read given such context in mind.
根源的な構成主義は、カント以降の近代哲学のポテンシャルを徹底した結果だと言えます - p564, 社会学史
Another book I had been reading during the trip is ガルブレイス - アメリカ資本主義との格闘. I started reading the book as 消費社会の神話と構造 occasionally refers to Galbraith. The book discusses how American liberalism approach, which argues for free-market capitalism, is creating those issues in education, medication, retirement etc. Its a nice book with many insights. By looking at the gap we can see the issues America is facing today. Its something that we must think about.
アメリカの現実とかれの理想との間の開きは大きい。公共性の認識を強調する彼の文章からは、よき西欧を知ったアメリカ知識人の闘いを感ぜざるを得ないのである - p180, ガルブレイス - アメリカ資本主義との格闘
There is this uneasiness that I occasionally get when I'm in the country, and if I were to describe it after reading the book, it might be coming from me not fully convinced with ...
アメリカにはそうした<ヨーロッパのような>過去はない...成功するか否かは、自らの努力以外...に頼ることなく自らの足で立つ自立の考えが深く根ざしていたのである。それが、スペンサーの思想<社会ダーウィニズム>を広く受け入れさせた土壌であろう
... given that the growth which is supposedly promised with such American approach doesn't really seemed be working if I were to look around. Maybe I'll take a look at パワー・エリート along with ゆたかな社会 as the book suggests in p126.
生産量の増加させることは好ましいというかつての通念 - 経済学の中枢にあった考えで、アダム・スミスからはじまり、マルクスを含め今に流れる"生産優位"という考えは、疑わしいものになっている - p107, ガルブレイス - アメリカ資本主義との格闘
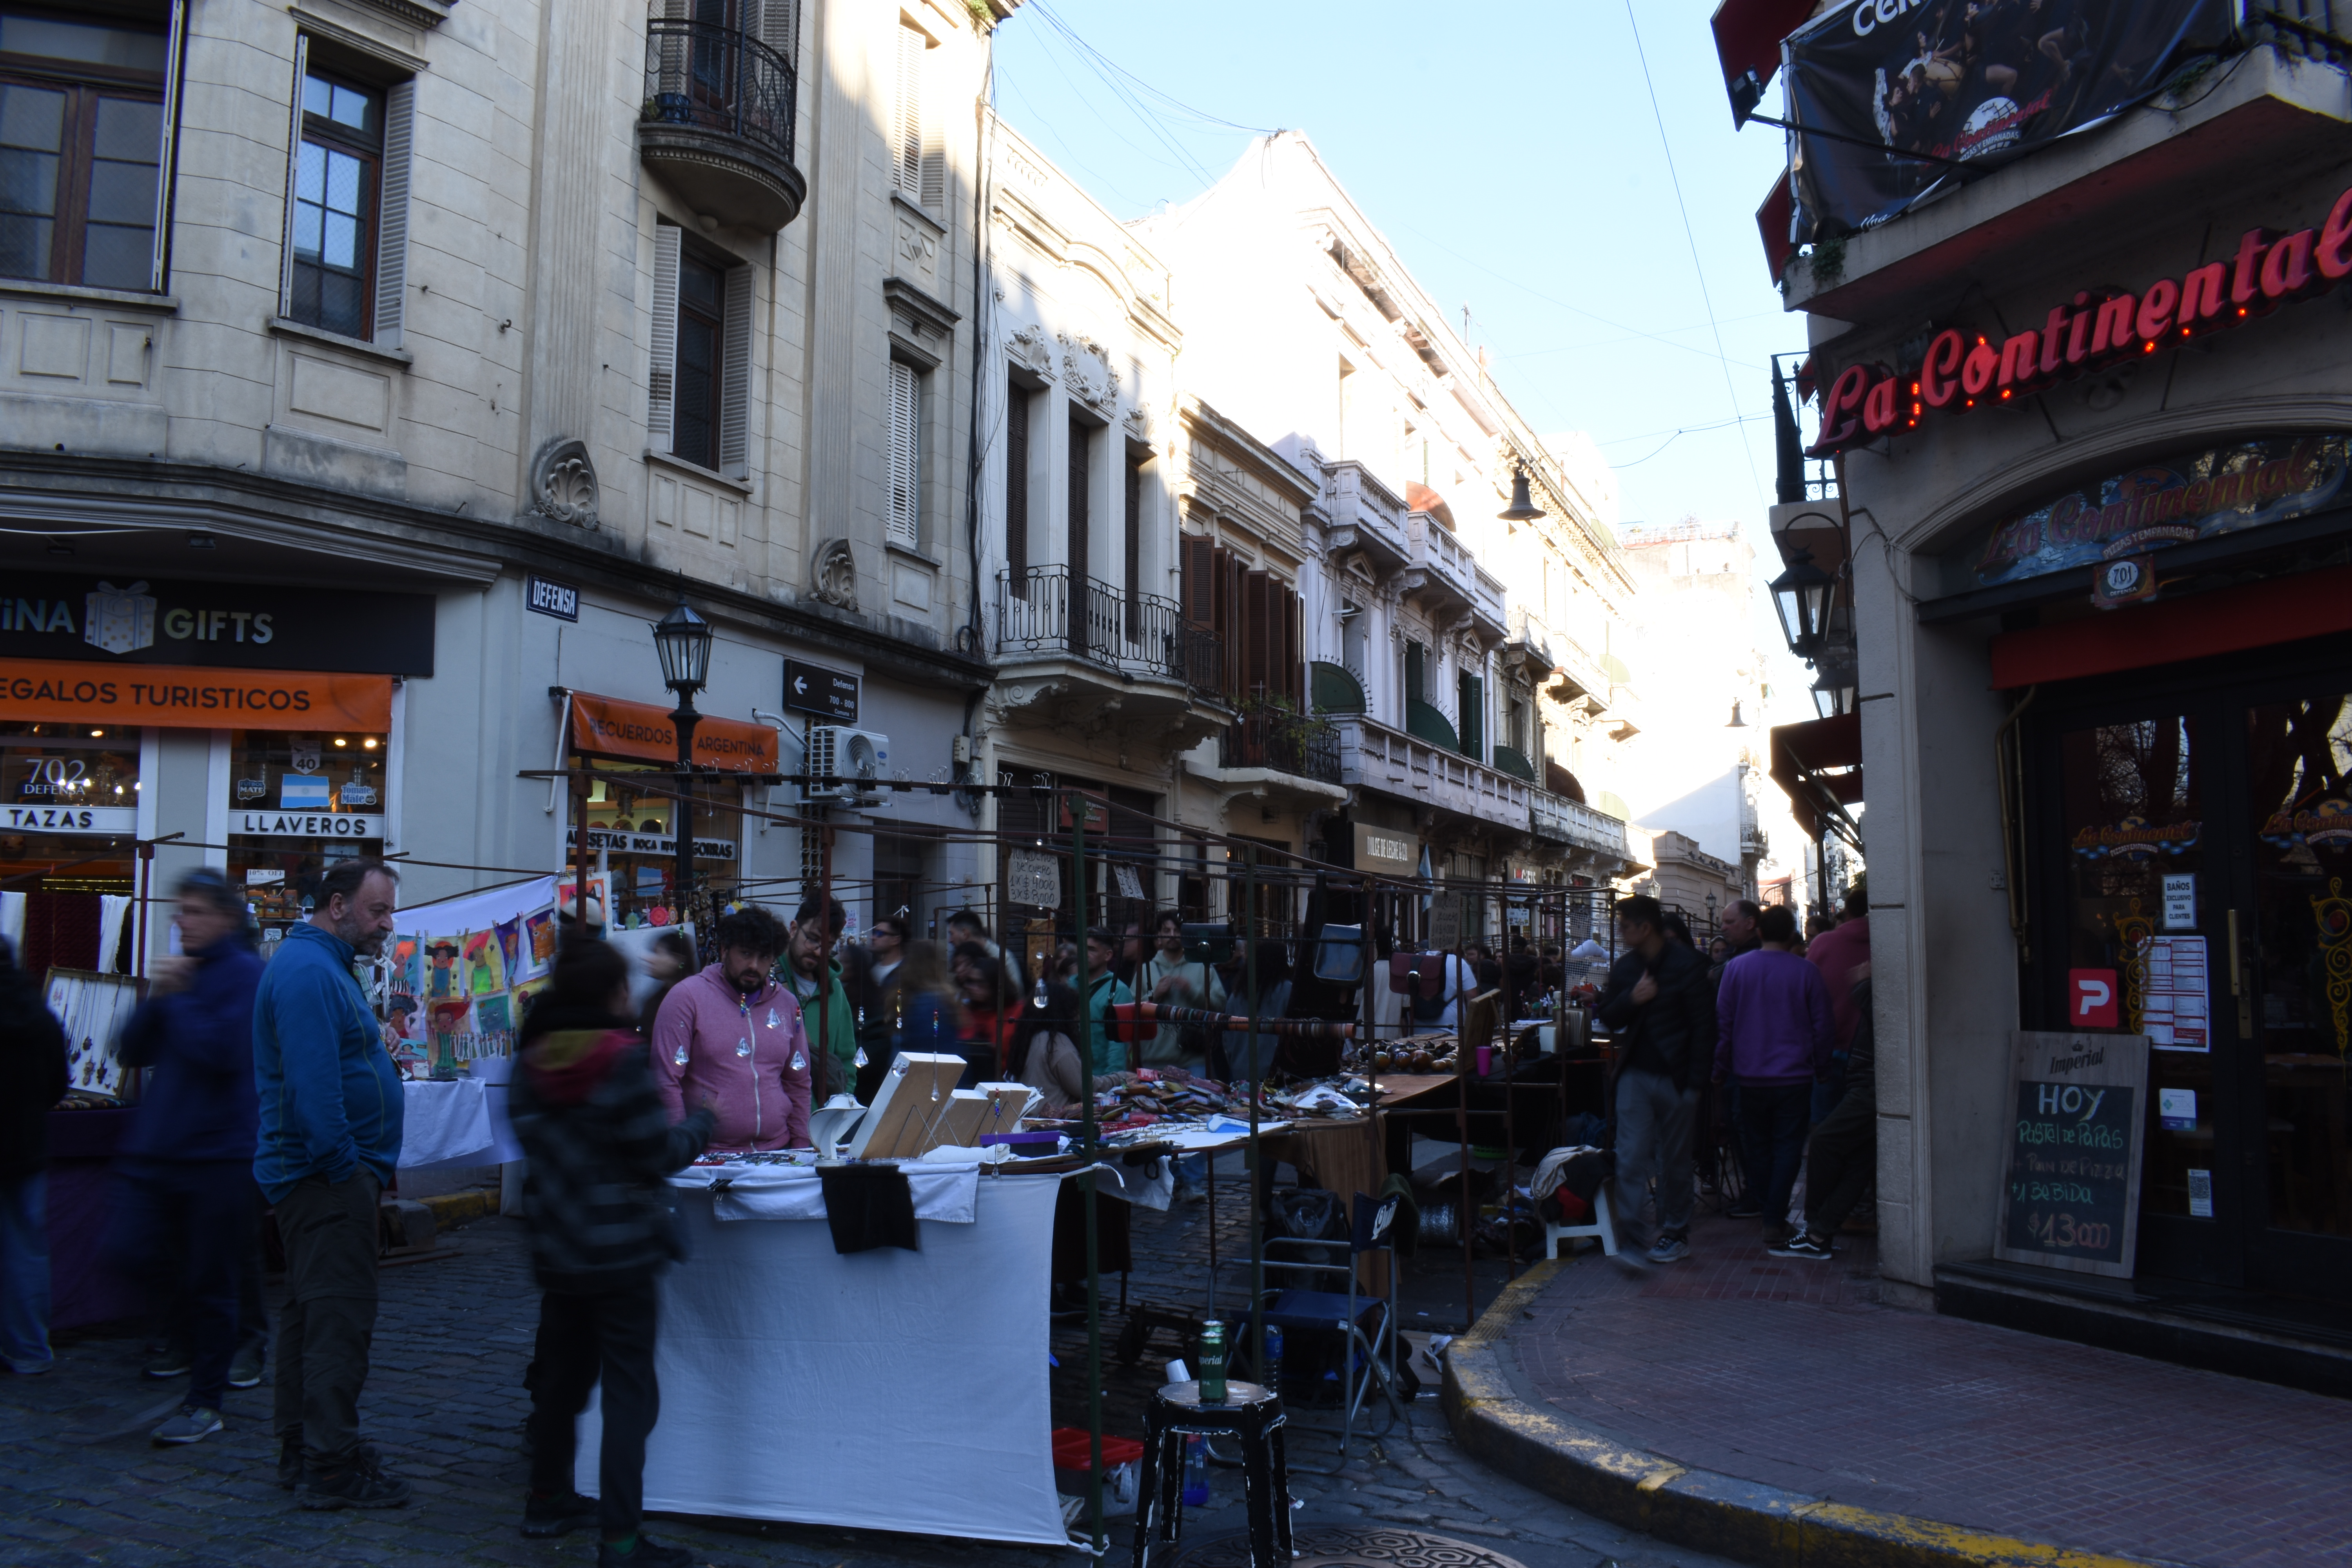
Enough about books, little bit about the trip. It was great. The city of Buenos Aires was beautiful and I enjoyed walking around [0]. I also went to Uruguay, and it was such a nice place to chill [1], and was so peaceful [2]. And as always, its nice to be back in America. It's the moment when I get back in Japan that I realize the country is my favorite, and start missing what I consider America, "America" haha. One thing that came as a surprise during the trip was the meal, Argentina is such a country with tasty food! I usually don't drink but this time I tried Malbec. My father told me this and that about wines while enjoying Bife de Chorizo😋. And mentioned this book, and the world sounds interesting. I might take a look into it.
Throughout the trip, I felt that we are all the same after all. Such differences like nationality, race, or language etc aren't that much of a difference. Its just that we live in a different society. It reminds me that what matters the most is to think myself and have my point of view ...
社会のさまざまな状況を現実的に、適応性を持って解釈する - 傷つきやすいアメリカの大学生たち
... and trips, and books of course, are great for taking a moment and reflecting on my interpretation of the world.
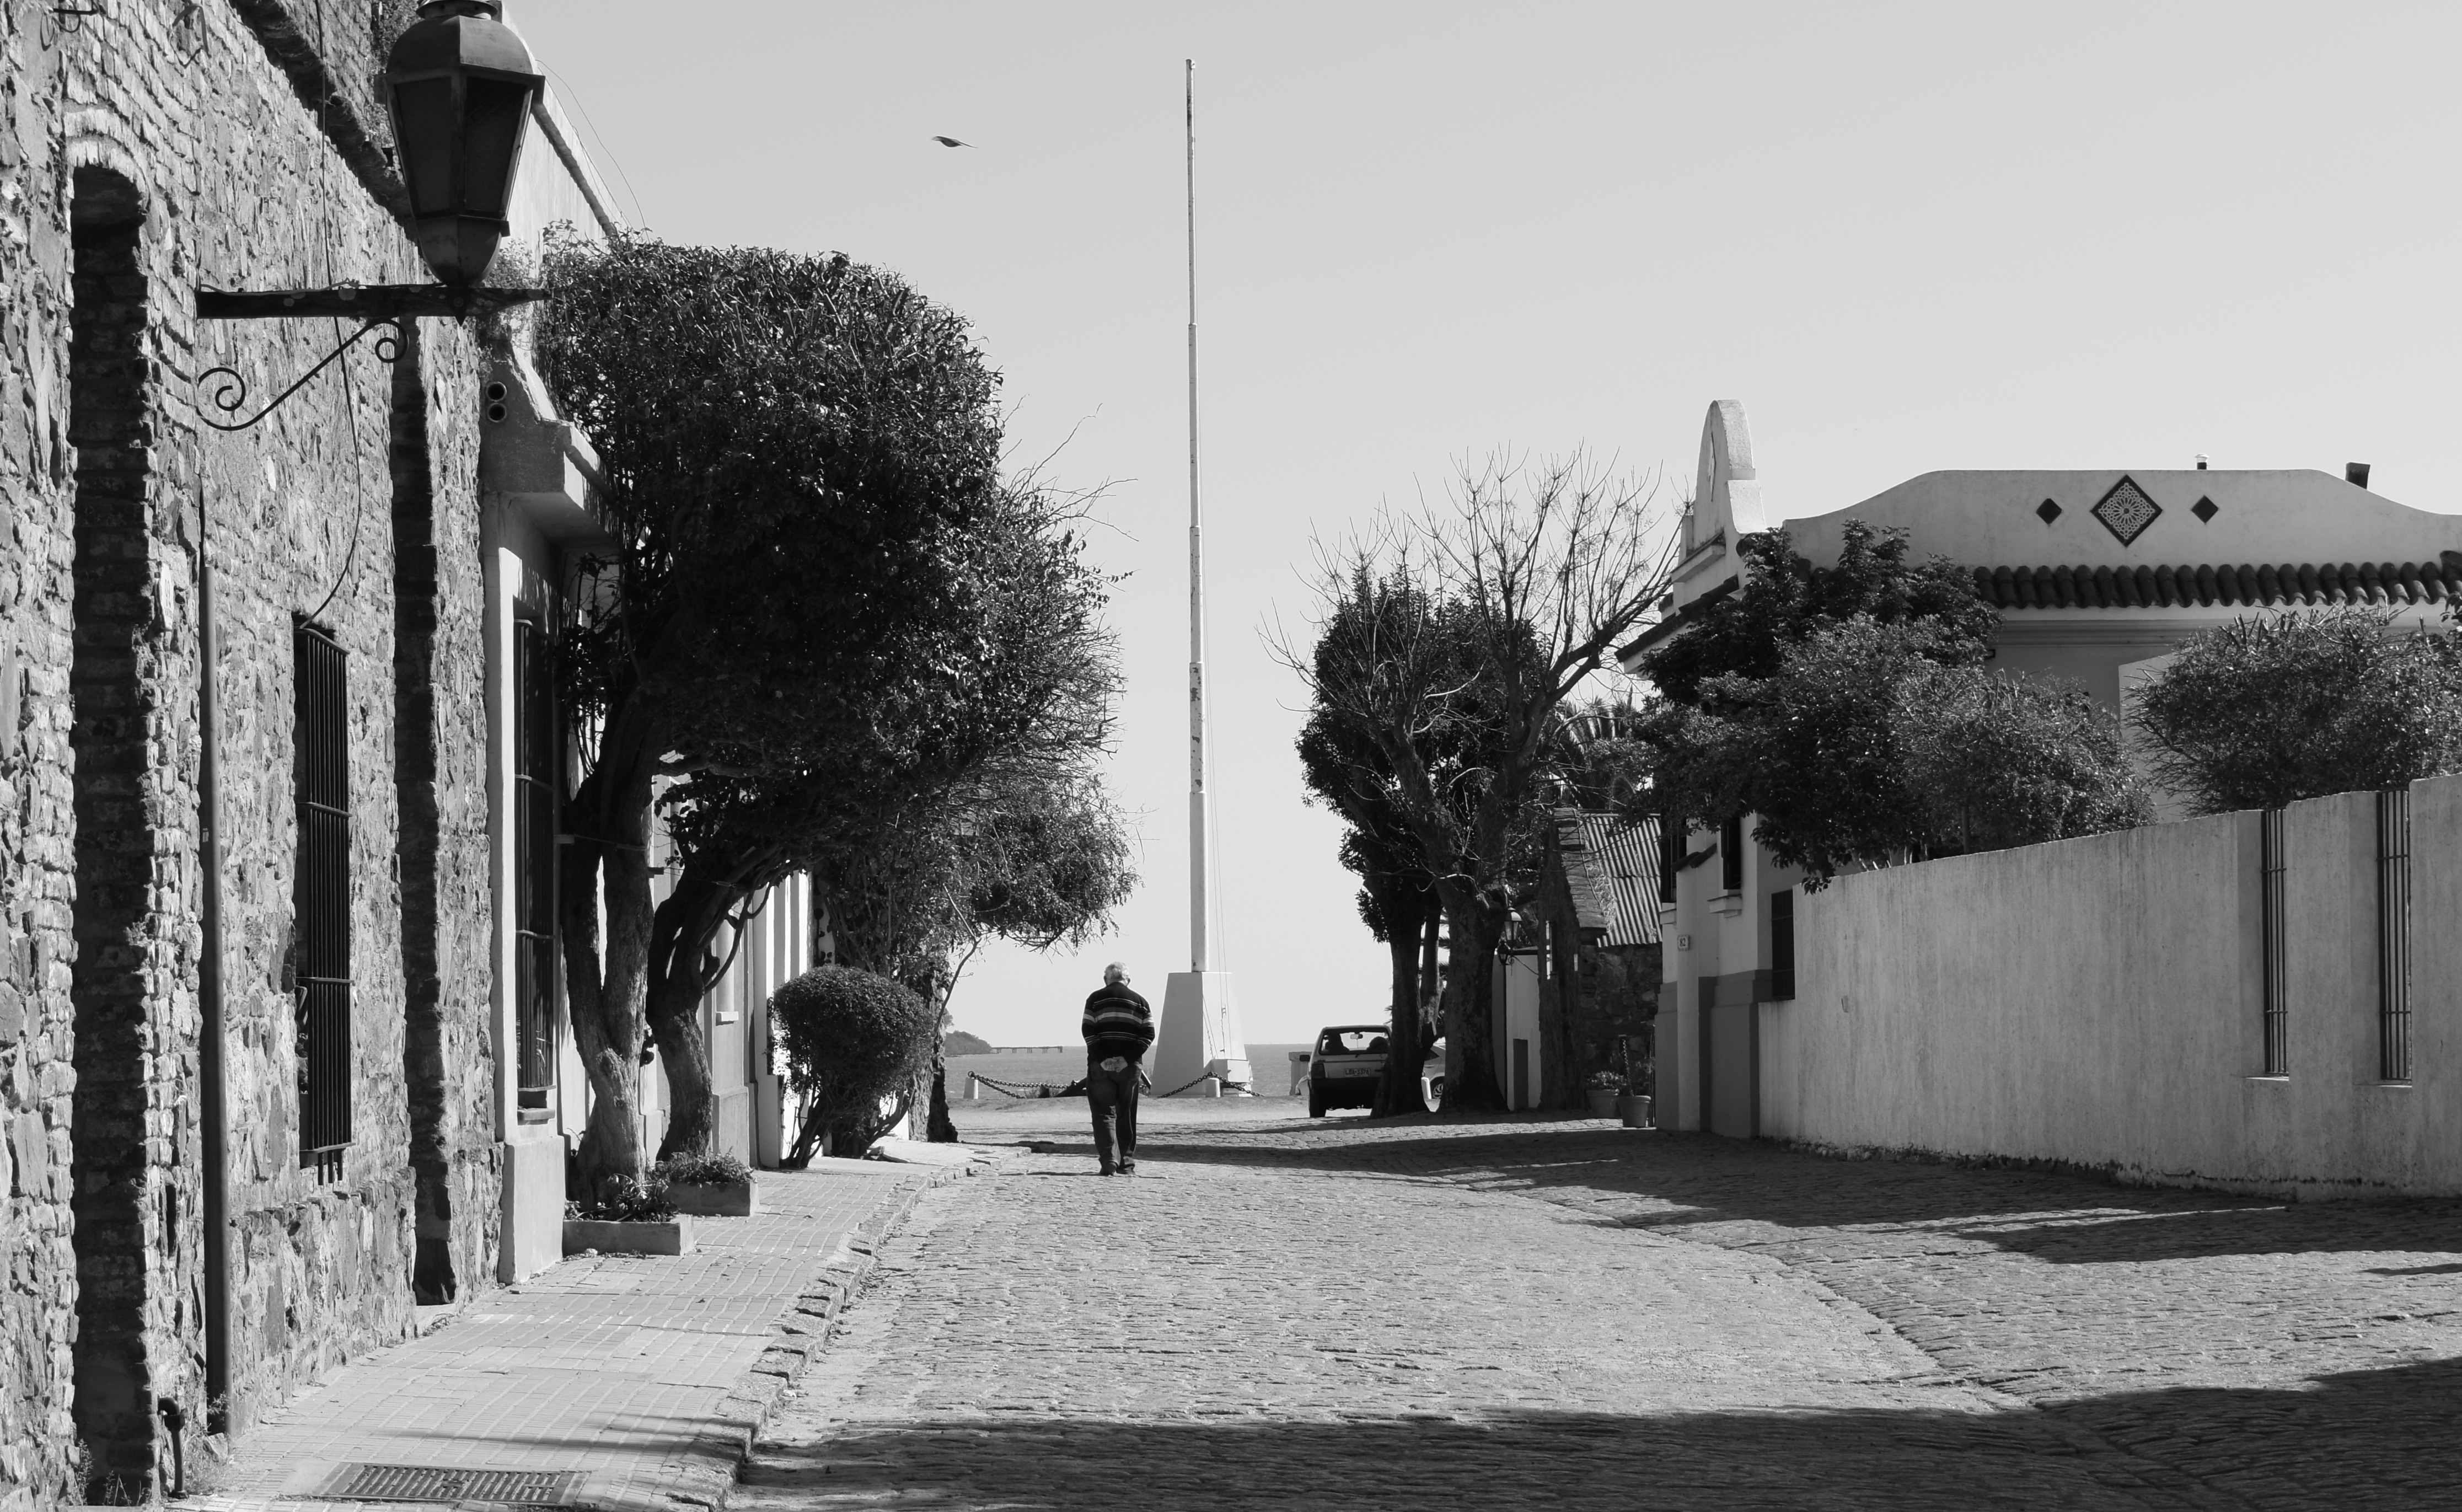
Colonia del Sacramento@Uruguay [2]
 Cafe@Colonia del Sacramento [1]
"Ratio"nal by Ryo
I'm writing this post somewhere above pacific. I found the analogy, or maybe its not an analogy but rather the very nature of the problem itself, interesting and quite accurately describing the issue. Its about how rational(合理性) and numbers are closely tied, and I can somewhat relate myself to it. To start with, the word "rational" comes from "ratio", which is a term we see in math. And if we were to answer to the question "what does it mean to be rational", the answer to that will be given as below. 比は、最も単純なものとの関係で構成される自然数の間の関係として定義できる...この曖昧さや残余がない...それゆえに自明なもの...明示的かつ一義的に定めることができるもの - p321, 社会学史 And there exists those numbers which doesn't have such 一義性, its 無理数. And we can see that 無理数 contains 自己言及性 by below equation, and such 自己言及性 is where the root cause of 曖昧さや残余, or 決定不能性. This discussion of introducing 無理数 to overcome 決定不能性 can be extend to social matters. 同じことがウェーバーの脱呪術化にも言える...超越的な神<無理数>を導入するということは...人間と神との間の自己言及の形式<決定不能性>を克服することでした - p325, 社会学史 The problem here, might be my personal one haha, is that its not really solving the the issue of 自己言及性, its only getting away with the issue. But maybe its not about "solving" as said below... 差異こそが合理性の原型です。宗教それ自体が合理的であるとヴェーバーは言っているわけではない - p316, 社会学史 ... and what really matter might be is in the attempt just like Céline says. If there's any kind of magic in this world it must be in the attempt of understanding someone sharing something. I know, it's almost impossible to succeed but who cares really? The answer must be in the attempt. - Before Sunrise By the way, the movie is always available on the airlines I use for some reason haha. That's it for this post!
アルゼンチン幻想文学 by Ryo
So I read the story before even taking off while at Narita haha. I think it was quite 象徴的 as he insinuated in the prologue and I like it. I believe くじ can be considered interchangable with 社会. そこでは、くじが現実の主要な部分を形作っている...今日までわたしは、くじについてほとんど考えたことがなかった - p82, 伝奇集 If I were to look at myself, I would like to think for myself and know what I'm betting for, unlinke him. But I don't think that changes the fact I will and need to keep betting. And I'm ok with it and believe I know how to take care of myself. 嘘のような話だが、それまで賭けについての一般的な理論を打ち立てようとした者は一人もいなかった...彼は偶然のくだす判断を尊重し、それに自分の生命や希望や深刻な恐怖などを賭けるが、偶然の迷路じみた法則や、それを示す回転する球体を研究することは思いつかない - p87, 伝奇集 Along with the story, I also studied little bit about Jorge Luis Borges and his background, and I found it quite interesting as much as the story itself. It was nice to learn about him before actually arriving Buenos Aires. Its interesting his stories ... パンパの無の上に築かれたブエノスアイレスの作家たちは、ヨーロッパのみならず世界全体の文化を貪欲に吸収しながら、読者の現実認識そのものを揺さぶり、我々の生きる現実世界を虚構化する文学を目指した - p65, ラテンアメリカ文学入門 伝奇集に収録された短篇は、膨大な知識と冷徹な論理を支えに日常生活からかけ離れた規則と論理に支配された空想世界を突きつけることで、読者の世界観を揺るがし、現実世界に対する疑念を引き起こす - p59, ラテンアメリカ文学入門 ... are reflecting such social background of Argentina back then. 魔術的リアリズムもアルゼンチンの知的幻想文学も、両大戦に伴う西洋の没落やアヴァンギャルドの隆盛、ラテンアメリカ内部でのナショナリズムの台頭、その他の諸要因によって、ヨーロッパに対するラテンアメリカの文化的従属性が崩れたことと大きくかかわっている - p64, ラテンアメリカ文学入門 And I hope one day to be one of those reader who can get captured by his storeies. マセドニオの言う読者の"登場人物化"を実現するためには.、読者を現実世界から引き離して作品内に取り込む必要があるが、ボルへスが読者の知性や知識欲を刺激することでこれを達成した - p62, ラテンアメリカ文学入門 By the way, I think there is something similar in the nature of his story ... 知的遊戯と言ってしまえばそれまでだが、その根底にあったのは、完璧なまでのプロットに貫かれた純粋フィクションの構築によって、アルゼンチンの危機的現実にかわる絶対確実な秩序を得ようとする一途な思いだった。その意味では、人間的要素を極限まで排したボルへスの短篇は、非人間的な文学ではなく、自らの生きる脆弱な現実世界をさらに揺るがせてその基盤を崩し、逆説的なかたちで不安を乗り越えようとする人間的な感情の表れだったと言えるだろう - p60, ラテンアメリカ文学入門 ... and what sociology is about. I kind of agree with the below statement, which remids me of the occasional feeling I get that I'm nobody, but that is rather my personal issue haha. I think what motivate to study "sociology" is that the very experience unique to you as 人間, as depicted in ベルリン・天使の詩. ヴェンダースのこの映画は、天使が持っている洞察力とか、天使が人間を見抜いているということを主題にしているのではありません。むしろ傍観者にとどまり続けざるをえない天使の哀しさが主題です...社会学という知にとっての究極の課題は、目一杯天使でありつつ、完全に人間であることはいかに可能か、にあるのだ、と。人間世界に対する冷静な観察者でありながら、同時に人を愛することがいかににして可能か - p254, 社会学史 アルゼンチン国立図書館に行くの楽しみ(笑)
Economist vs Sociologist by Ryo
One interesting way to look at the difference between economist and sociologist. Sociologist treats consumers … 経済の目的は個人のために生産を最大にすることではなくて、社会の価値体系との関連において生産を最大にすることである - p97, 消費社会の神話と構造 … vs economist. And as you might have guessed from the previous post, I’m with sociologist haha. 経済学者にとっての消費者は相変わらず目的合理的に計算をする理念的に自由な個人にとどまる…概して人間主義の伝統に立った古い道徳や社会哲学のなかに根を張っているもの - p99, 消費社会の神話と構造 If economic can be considered to be such a medium which reflect the very nature of our society, wouldn't it also give us an insight into our very selves? Maybe that is what its done in 消費社会の神話と構造, プロテスタンティズムの倫理と資本主義の精神, or 資本論, studying society from more of a “sociologist” perspective rather than “economist”. And it makes me wonder that I might able to learn something different from those books like 雇用・利子および貨幣の一般理論 with such perspective in mind. By the way, I’m just about leave for Argentina and my friend told me about Jorge Luis Borges. Hope to read his バビロニアのくじ before I touch down Buenos Aires haha.
Stayin' Alive by Ryo
It points out that there is a structure that can be studied just like how languages can be studied. 消費の社会的価値について...使用価値の個人的取得の論理とはまったく別のものであり、欲求充足の論理でもない。それは社会的意味をもつものの生産および操作の論理である...消費は交換のシステムであって、言語活動と同じである。このレベルでの消費の問題に取り組むことは構造分析によって可能である - p50, 消費社会の神話と構造 I remember that I was once interested in language back in college. I think I now have a more tangible reason for going after it, given that the book says it can describe the consumerism society today and how we fit within. I always needs a good excuse whatever that might be if I were to get my hands on. I'm such a reluctant person 😅. 消費の基本的性格、つまり限度がないという性格を解明できる。この性格は欲求と充足に関するいかなる理論によっても説明できない。というのは...使用価値として計算すれば、たちまち飽和点に達してしまうからに違いないからだ...消費システムの安定化が不可能だとという事実、つまり消費の熱狂と限りない前進を前にした経済学者や理想主義的福祉論者たちの狼狽は、いつ見ても教訓的である - p82, 消費社会の神話と構造 Note that I believe one of the economist that he is criticizing is Galbraith. Maybe I should keep reading ガルブレイス - アメリカ資本主義との格闘 with his criticism in mind. Also, there was this line ... 個人は差異の秩序のなかでポイントを稼ぎ、秩序そのものを再生産し、したがってこの秩序のなかでは相対的にしか記録されない定めになっている。各個人は差異による社会的得点を絶対的得点として体験する -p81, 消費社会の神話と構造 ... which I found is a quite accurate description of how the escape happens. Its those moment when you recognize the 相対性 in the 絶対性 which you used to believe in. いわゆる"近代文化"-が、自らを決定的であるとする思い込みこそ、視界に生じた信じがたい頑迷さと狭隘さではないのか、という漠然とした直感がその根底に見出される。そしてそのように感じる時、私たちは自分たちが狭く閉ざされた場所から逃れ出て、再び星空の下に立ち、最善のことも最悪のこともすべてが可能な、真正で深遠で、恐ろしく見通しのきかない底しれない世界に出たのだという、えも言われぬ印象を持つのである - p95, 大衆の反逆 Back in college, I used read Sartre, Stirner and such, and it was after learning structuralism that I got such impression. I was pretty shocked haha. But I didn't really go after it like mentioned earlier at the time. This time, I will go after and starting with ソシュールを読む. Let me know if you recommend any other introductory books! By the way, I wonder if I have made any kind of progress ever since college. I found myself still listening to the song, trying stayin' alive 🎵. The difference is that back then I didn't really care about how New York Times' affect on man, which I now do.
What makes a "man"? by Ryo
Its during the morning bus commute where I read books. And I wonder if what I see from, and within the bus is exactly what described here. 現代の日常生活では、多くの場合、消費は導かれた消費性として、生産性の命令に服従している。それゆえ、ほとんどの場合、モノは場違いに存在しているので、モノの豊かさ自体が逆説的ではあるが貧しさを意味している...モノは破壊においてのみ真にあり余るほど存在し、姿を消すことによって富の証拠となる - p55, 消費社会の神話と構造 Also, I was recently reading this article and saw this line saying 「価値のある」顧客. エルメスは、バーキンを「価値のある」顧客にしか販売せず、他の商品を購入することをバーキン購入の条件にしていると主張する客2人からカリフォルニア州で訴えられている It reminds me of this line, I guess we are not equal in front of Birkin haha. なぜなら、すべての人間のはモノと財の使用価値の前では平等だからというわけである...使用価値としてのビフテキを前にしては、プロレタリアートも特権階級もないのである...ただし交換価値の前では不平等であり反目しているが - p60, 消費社会の神話と構造 Lastly, I don't think we can agree with George Micheal on what makes man a "man" if we were to go with the logic of Birkin😂. --- Added as of 2025/07/31 --- I believe the discussion here is similar in nature to what Max Weber was criticizing regarding 抽象的な"価値"の蓄積. 潜在的消費力が平等になるという事実(所得の均等化、社会的再配分、みんなが同じ流行を追い同じテレビ番組を見て、地中海クラブに集まる)を証明できるかできないかという問題は、何の意味もない。なぜなら、消費の平等化といった言葉を用いて問題提起することは、真の問題の論理的・社会学的分析をやめて、その代わりにモノや記号を追いかけるということになるからだ。要するに、"豊かさ"を分析することは、数字の上での豊かさを確かめることではなくて、根本的に頭を切り替えて、豊かさの神話をその論理とは別の論理によって分析することなのである - p61, 消費社会の神話と構造 --- Note as of 2025/08/01 --- モノは記号の形をとるときにこの構造的規定を受けとる...経済的意味で、モノを前にした不平等が存在するばかりでなく...環境に内在する諸要素の自立的で合理的な論理に接近できるという意味の差別だ。これらの人びとはモノとは関係なく、正確にいえば"消費"しない - p77, 消費社会の神話と構造 Its about the way I play the game 🎵. Might be a good subject to think about over summer.
ケインズ—時代と経済学 by Ryo
It was a good introduction for someone like myself with absolutely no idea what economics is about describing how one theory were introduced given the background at the time. I admit that I skimmed all those math part but I hope I got the basic idea and its significance until today😅. Maybe I'll try 雇用、利子および貨幣の一般理論 for the next, which I found it was being forgotten and piled up amongst the other books. My takeaway is that while Neoclassical models places emphasis on equilibrium which is achieved on its own, Keynesian argues for demand where there is a need for involvement of government. I still need to go back and forth the book to understanding how those two can provide different explanation for things like interest or unemployment rate, but for now I think its enough to just keep in mind how the two differ in the very basic idea which they depend on. 新古典派理論において、生産水準と労働などの雇用量を決めるのはコスト<限界費用>である...現実の経済においても、こうした<恵まれた>情況で生産を行っている企業もあるだろう...しかし...大多数の企業は、もし売れるならもっと生産を行いたいのだが、作っても売れないからそれ以上生産を行いのではないか...彼が"有効需要の原理"と呼んだもののエッセンスを述べれば以上のようになる - p135, ケインズ—時代と経済学 One interesting line I found in the book is its referrence to リアル・ビジネス・サイクル理論. すべからく現状を肯定するリアル・ビジネス・サイクル理論は新古典派経済学の"終着点"というべきものである...市場機構礼讃の合理的期待学派、リアル・ビジネス・サイクル理論が盛行したのも時の流れであったのかもしれない...いずれにしてもそれ自体将来の思想史、経済学史上の興味ぶかい研究対象となるであろう - p193, ケインズ—時代と経済学 It reminds of what was said about historians back in 19th centry. Considering today's historians' view of history, I see a common ground in 有効需要の原理 given they both argue for human involvement. 見えざる手が普遍的調和の心配をしてくれるだろう。歴史上の事実それ自身が、より高いものへ向う恵み深くかつ明らかに限りのない進歩という思考の事実を立証するものと見られていたのです - p23, 歴史とは何か The line also rang my bell from another book regarding Spencer's view on education. I believe in such 合理的期待 seen in 楽天的マクロ経済, while agreeing that its quite unrealistic in practice😅. スペンサー氏に従えば、合理的な教育は...子どもをまったくの自由に放任しなければならないだろう - p56, 社会学的方法の基準 By the way, speaking of analogy, there was this metaphor describing stock market as beauty contest. I think similar nature can be seen in Rousseau's "general will". Its something to think about looking at the politics these days haha.
20代 by Ryo
By the end of my 20s, with a little clearer view of the world after reading all those books, I would like to go out for a trip seeing the world by myself. I'm sure real life can wait 🎵. あと、20代を振り返った時に、世の中の役に少しは立てたかなと胸を張れるよう過ごしたい。 One more, I want at least to go as far as those people have reached until today. 人々が、自分で考えているよりもはるかに自由なのだと教えること、人々が自明で真理だと信じているいくつかのテーマが、歴史の特定の時点に作り出されたものであり、このみかけの上での自明性は批判し、破壊することができるものだということを示すことです。それが知識人の役割です。 - Foucault 自分の正しいと思う考え方(思想的な)を、振り返ってそれが間違っていたとしても、自由に思う存分追求できたと言えるような20代にしたい - September(?) of 2025 自分が生きることのなかった時代にも共感、感得できるような人間になりたい - 2025/10/21 I'm confident about the direction I'm heading, just keep learning and I should be fine. So don't worry, be happy haha. - 2025/10/23 社会主義はたとえば「人間の同一性」という思想から出発する。マルクスがその種の社会主義的な理想家を批判したのはいうまでもないが、それは彼が<価値>に関して、よりつきつめた洞察を固有していたからである - p48, マルクスその可能性の中心 社会科学者の使命の一つは、歴史的変動の性質と、もしあればそこにおける自由で理性的な人間の場について、自分自身の見解を定めることなのである。そうして初めて彼は、自分が研究している社会における自らの知的・政治的役割を知るようになり、その際、非常に深いところで社会科学の伝統と約束の一部である自由と理性の価値について、自分が実際にどう考えているのか気づくのである - p321, 社会学的想像力 Beyond that, I'll see!
大衆の反逆 by Ryo
It was one of those books which gives insights into the world today, and myself. Maybe I'm still the 若者 referred at the end of the book. But not sure if there is anything that I can do about it. Hope I'll figure it out. For the next book, I would like to read 消費社会の神話と構造 or 大転換 expecting the same kind of insights. Maybe I'll start with the 消費社会の神話と構造, along with 社会学的方法の規準 which is still sitting next to my Raspberry Pi😅. I wonder if 大転換 is better read with little bit of background on economics, I'll look into it. It's interesting to find out how society are being shaped by economics, and its consequence on us. Hope to read ゆたかな社会 and 孤独な群集 at some point as well. W. W. ロストウ(Walt Whitman Rostow)によれば、経済成長の結果として欧米先進諸国は20世紀に「高度大衆消費」の段階に入る。また J. K. ガルブレイス(John Kenneth Galbraith)によれば「ゆたかな社会」がアメリカ社会の日常として実現する。だが、こうした社会のありかたを資本主義というベースから批判的にとらえ返したのが J. ボードリヤール(Jean Baudrillard)の「消費社会論」であった。たしかにガルブレイスも「ゆたかな社会」における人間の疎外を描き出し、D. リースマン(David Riesman)も大衆社会の孤独を描き出そうとしたが、ボードリヤールの消費社会論はそうした人間学や社会心理的な分析ではなく、記号論的分析やマルクス(Karl Marx)の価値形態論をベースにしながら消費の社会学的分析を行ったところに特色がある - 現代社会学事典
Freedom! '90 by Ryo
科学の明晰さは、それを実践する頭の中というよりも、彼らの語っている対象の中にある - p269, 大衆の反逆 The above is very true for me in terms of what I consider and where I found the fun in Linux kernel. Its 明晰さ is within the 対象 itself. But what's interesting about social science, this world in other word, is different as the 対象 is 彼ら himself. And such nature of studying this world is what interests me, which requires 明晰さ of different kind. 本質的に混乱したもの、錯綜したものこそが、具体的な生の現実であり...好むと好まざるとにかかわらず人間が突然はまりこんだ唯一無二の状況からできあがっている - p269, 大衆の反逆 Maybe such 明晰さ begins with the feeling of what described as 偶有性 ... "現に起きている社会現象に対して、ある種の不確実性の感覚を持つ"...それがいかに可能か、可能だったのか、可能になりうるのかを問う...それが説明を要さない自明のものに見えてしまったら、探求の対象にはなりません - p18, 社会学史 ... or 不合理 in the "world" we see. Or I guess they are the same? 事実を説明するためであれ制御するためであれ、その事実が不合理と感じられてこそ、人は事実の奥に進むよう誘われる - p21, 社会学的方法の基準 公式的見解や表明の背後にある構造が見通され、"ものごとはみかけとおりではない"として現実感が一変する知的興奮である - p18, 社会学の名著30 But the kind of excitement I find in Linux kernel might be the same in a sense seeing the very nature of things. Still, it differs in a way described as below, and the difference matters a lot. 見慣れたものの意味が変容するのを知るときの興奮である...今までの人生を通じて生き続けてきた世界を、社会学の視界によって新しい光の下で見直すことを可能にしてくれることにある...この変容は、他の多くの学問分野で経験するのもよりも、人間の存在にとって持つ意義が大きい。というのは、社会学による意識の変容がそれをこうむった個人の精神全体に及ばない、ということはほとんどありえないからである - p18, 社会学の名著30 I like what Keynes says about finding the ground to stand ... 大著を書く光栄は一人アダム・スミスに任せ、自らの生きる時代の確信をつかみ、パンフレットを風にまき散らすことを仕事としなければならない - p80, ケインズ—時代と経済学 ... and I hope to be someone who lives with such awareness of the world. そうした現実の中で正確に自己の位置を定めることのできる人、あらゆる生の混沌の下で、瞬間の秘密をかいま見ることのできる人...そうした生の中で道を見失わない人 - p270, 大衆の反逆 With all that being said, I'm such a young boy given I know so little about the world. There are a lot more out there to learn! By the way, I just bought a ticket to Argentina. Its a trip with my father, and I always find something special about traveling with my father. Also note that I'm still studying Spanish, and I'm kind of starting to enjoy :)
Don’t Worry, Be Happy by Ryo
概念としてはきわめて真面目にこう言うであろう。"これはAであり、あれはBである"と。しかし...とことん調べてみるなら、それは事物そのものについては何も言っておらず...彼は、これはAではないと隅々までよく知っているし、そしてもう一方もBではないとはっきり認識しているのだ...厳密に言うなら、私はこれがAでもあのBでもないことを知っている。しかしそれがAでありBであることを認めることで、あれこれの現実に対する自分の態度に私自身が納得し折り合いをつけるのだ - 大衆の反逆 I believe the 概念 here is discussed by Max Weber in a similar manner as 魔法, or by Sombart as 方式. 今まで錯雑した現実の中で私たちを導いてくれた安らかな方式を失うとき・・・私たちは新しい足場を見出すか、泳ぎを覚えるまでは、事実の大海に溺れるような感じがする - 歴史とは何か The world seems its full of what described as 概念, 魔法 or 方式, which I'm sure I will find out more in those kind of books. And I think that is exactly the reason for going after the books, emerging yourself in 事実の大海 until you find your 足場. And in case if I feel like drowning, the song is there to lift me up haha. By the way, I was thinking about how disabling IRQs could be considered as equivalent of disabling preemption. The reason is kind of obvious, but its the "obvious" where I find the most excitement. And maybe that is what I like about Operating System!
README by Ryo
So for the introduction, I write as below. And I thought I might be able to elaborate a bit more, along with the books that I read recently. Unlike tech, I believe there can't be right or wrong, its just how you perceive things which is subject to change. But I believe that's the fun part of life and where learning comes in! I believe what I'm about to write down is well summarized in below quote .... 個人は...世界において起こっていることを把握し...時代状況のなかに自分自身を位置づけることによって...社会における個人史と歴史とが交差するささやかな地点として彼ら自身において何が生じているのか...自分固有の経験とは何かを理解し、その行く末を見定めることができるようになる - 社会学的想像力 ... and its for the reason below. 歴史家は彼自身の時代の人間なのであって、人間存在というものの条件によってその時代に縛りつけられているのです - 歴史とは何か One such interesting example can be seen in the reason why 19th centry's historians were uninterested in 歴史哲学. 19世紀は、自信とオプティミズムとが滲み出た居心地のよい時期でした...歴史上の事実それ自身が、より高いものへ向う恵み深く且つ明らかに限りのない進歩という至高の事実を立証するものと見られていたのです...ランケは、自分が事実の方を心配していれば、神様が歴史の意味を心配してくれるものと敬虔に信じておりました - 歴史とは何か Analogy of that is the discussion surrounding Weber's 方法論 in America. 方法論への関心は、当初のアメリカのウェーバー受容では、それほど高くはなかった...方法論を論じるということは、それまで当たり前に行われてきたことの当たり前さを問うということ...資本主義とデモクラシーへの安定が信頼が存在しているところで、深刻な方法論的な問い直しがおこなわれることはなかった..."科学としての政治学"を標榜していたアメリカ政治学では、事実の重視は当初から自明の前提であった...このような状況が変化してきたのは...<黒人の公民権運動などの人種問題、エコロジーの問題、そしてベトナム戦争の泥沼化に直面した>...1960年代であった - 中立とは何か Further, the discussion of 事実 can be extended to 主観 and 客観, just like Weber's 方法論. 価値自由を論じる時の一つの論点は、価値自由な学問が個人の決定・決断を拘束する力をどれくらい持つと考えるのかという点にある。学問によって政治的な決定・決断の余地がかぎりなく"一択"に狭められると考えるか、あるいは学問は決定・決断を前にしてほぼ無力だというくらいに、非合理的な"飛躍"を強調するのか - 中立とは何か And this can be discussed in a "Historical" context as below. 歴史家と歴史上の事実との関係を吟味して参りますと...歴史を事実の客観的編纂と考え、解釈に対する事実の無条件的優越性を説く支持し難い理論の難所と、歴史とは、歴史上の事実を明らかにし、これを解釈の過程を通して征服する歴史家の心の主観的産物であると考える、これまた支持し難い理論の難所との間、つまり、歴史の重心は過去にあるという身方と、歴史の重心は現在にあるのだという見方との間であります - 歴史とは何か With the above being said, he generalizes as below ... 歴史家の陥っている窮境は、人間の本性の一つの反映なのであります...人間というものは、決して残りなく環境に巻き込まれているものでもなく、無条件で環境に従っているものでもありません...歴史家と事実の関係は平等な関係、ギヴ・アンド・テークの関係であります...歴史家というのは、自分の解釈にしたがって自分の事実を作り上げ、自分の事実にしたがって自分の解釈を作り上げる不断の過程に巻き込まれているのです - 歴史とは何か ... which I found is very similar what Richard Power's novel is about. パワーズの描く世界にあっては、人間は世界を作る存在でもあり、世界によって作られる存在でもある。対象が一枚の写真であれ、一人の他人であれ、第一次世界対戦であれ、我々はつねに共犯関係に巻き込まれ、つねに共犯関係に追い込まれている。世界を解読するたび、我々は自分というファイルを更新している...こうした考え方を通じて、読み手は、自分が世界とどうかかわったらよいのかについてのレッスンを受けることになる - アメリカ文学のレッスン And may be this blog is about me trying to understand myself better in a way as described below, trying to figure out how I'm engaged and should engage in this world. 読むことは、書くことによって導かれ、方向を与えられ、豊かにされます。書けば書くほど、私が求めているものを一層よく知るようになり、自分が見出したものの意味や重要性を一層よく理解するようになります - 歴史とは何か 本にしても、絵にしても、音楽にしても、旅行にしても、自分と世界との関係を考え直すという上記のような意味合いでは、どれも本質的には同じなのかなと思い始めています。なお、カーネルを読む面白さは別です笑。 For those who somehow found this blog, please not that this blog is not intended for anyone but myself. So I'm not really paying to attention to English, and might occasionally be writing in Japanese whenever I feel having trouble bringing English to "myself". Just like how Bantu should be brought to Shakespeare but not the other way around. 翻訳とは、移植したいという渇望とは、シェークスピアをバンドゥー語に持ち込むことが肝心なのではない。肝心なのは、バンドゥー語をシェークスピアに持ち込むことなのだ - アメリカ文学のレッスン Other than my poor English, I'm sure there are inaccuracy and misinterpretation of how I read the books. It would be nice to be pointed out those mistakes. Thanks!
Where I find the fun by Ryo
I read a book at the barber while I wait, and today I started reading this book. Here I'm writing some of the lines, as I found the introduction already 申分なく重大 haha. Starting with this line ... 事実は自ら語る、という言い慣わしがあります。もちろん、それは嘘です .. and it can be said in a more historian specific way as below ... 歴史家の解釈から独立に客観的に存在する歴史的事実という固い芯を信じるのは、前後顚倒の誤謬であります ... giving such an interesting example. 1066年にへスティングで戦闘が行われたことをことを知りたいと私たちが思う理由は、ただ一つ、歴史家たちがそれを大きな歴史的事件と見ているからにほかなりません What the above suggest can be said as below. 歴史的事実という地位は解釈の問題に依存することになるでしょう...歴史上の事実ということになったのは...意識的か否かは別として、ある特定の見解に染め上げられていた人たち、この見解を立証するような事実こそ保存する価値があると考えていた人たちによってのことであります And with that all being said, he says that there is additional job specific to historians studying today. 彼には、少しの重要な事実を発見して、これを歴史上の事実たらしめると同時に、たくさんの重要でない事実を非歴史的事実として棄てるという二重の仕事があるのです What I thought is that such an attitude of historians, being aware of what he is studying, or deciding weather to treat a fact as "fact", is also needed in everyday life today. I believe such an attitude could be applied to myself given the "fact" I see today on news or whatever kind of social media are being processed in a similar kind of manner. What's more is that they are like the 不透明な前提(p77) if I were to form my point of view. But this is where I find the fun, just like how he describes what historian does. 歴史家は、歴史の"補助科学"と呼ばれて来たもの - 考古学、金石文字、古銭学、年代学など - を頼りにすることができるのです...いかなる事実に、また、いかなる順序、いかなる文脈で発言を許すかを決めるのは歴史家なのです
Next book? by Ryo
Hi, another book review for this book. I always feel something 自己実現的 reading this kind book, such another book is this. And it's occasionally suffocating if I were to quote from the book, like there is no way out. To summerize, the idea of 労働力商品の所有者としての労働者 and 消費社会 are the two where I find such 自己実現性. Its kind of ironic like what we believe to be logical isn't really logical given the logic of Capitalism, as said below. ウェーバーが"プロテスタンティズムの倫理と資本主義の精神"の末尾部分で...近代社会を激しく糾弾したのは...そのような社会に適合して生きる近代人が、実際には倒錯的なものでしかない自らの精神的態度<形骸化した"禁欲">を合理的なものとして誇っていることへの憤りゆえであった And maybe what we need is such spirit of observing the world just as it is, said by Spinoza, but I would like to find laughter and pity in such observation opposing to Spinoza as the author suggests. 笑うな、泣くな、ただ理解せよ With that all being said, there were couple of books introduced, which I would like to read if I were to go further on the topic. I was interested in how the transition from Imperialism, Fordism and 消費社会 can be explained by, fits in to the picture of 資本論. Maybe I should take a look into 大転換 and 消費社会の神話と構造 as recommended. Reading such books gives better understanding of how today came to "today", and how I came to end up in such "today". ポピュリズム大陸 南米 is rather for pure curiosity, as I'm thinking of visiting Argentina next August, and thought would be interesting to learn its history and how the current libertarian government came to place given below. 無論、ヨーロッパや南米などで、反新自由主義を標榜する政権が登場するなどしているが、その打倒には程遠い And yes, I also need to start studying Spanish as well. That's it for today's post! --- Random thought from 2025/07/02 --- The trip to Argentina isn't that cheap, considering how much I make. And this makes me wonder it's not the money in itself where the value resides. I mean if you don't spend it for time or things you value, isn't that as just same as you not making that amount of money. Reminds me below. プロテスタンティズムの職業生活の成功によって自己の救済を不断に確信せねばならないという信仰から合理的で勤勉な生活態度...を"世俗的禁欲"とウェーバーは呼んだが...それは、財の有用性を享受することではなく、抽象的な"価値"の蓄積へとすべての努力を振り向ける I guess spending isn't as easy as it sound :-) Might be good to think about what I really value.
Interesting, and Impressed by Ryo
I'm writing this post because I was impressed by what its written haha. The book explains 労働力の商品化 as 諸在価値 to be 通約可能. And argues how such 通約可能性 wasn't possible back in Greece for the reason below. ギリシア社会は奴隷労働にもとづいており、したがって、人間とその労働力の不等を自然基礎としていたのであるからである And it continues discussing the nature of 貨幣 specific to Capitalism as the 通約可能性 and its consequence as below. 本来、何らかの具体的欲望をかなえるために貨幣を求める、というのが欲望の正常なあり方だとすれば、ここで現れるのは貨幣それ自体への欲望である...倒錯性 Its interesting how it associates this 倒錯性 to those 規範 seen in 前近代社会. したがって、古代社会は、貨幣を、その経済的なおよび道徳的な秩序の破壊者として批判する It also associates this 倒錯性 to 抽象的な価値の蓄積 within the context of Max Weber's Protestantism on Capitalism ... プロテスタンティズムの職業生活の成功によって自己の救済を不断に確信せねばならないという信仰から合理的で勤勉な生活態度...を"世俗的禁欲"とウェーバーは呼んだが...それは、財の有用性を享受することではなく、抽象的な"価値"の蓄積へとすべての努力を振り向ける ... which leads to the modern Capitalism. And I believe this transition is what The Great Gatsby was depicting. この...勤勉さは、その原初の緊張感を失っていき、致富に成功した資本家は奢侈に流れもするだろう And below sounds to explain a lot of what I see in myself, and I'm impressed how things can be explained in such manner. ウェーバーが"プロテスタンティズムの倫理と資本主義の精神"の末尾部分で...近代社会を激しく糾弾したのは...そのような社会に適合して生きる近代人が、実際には倒錯的なものでしかない自らの精神的態度<形骸化した"禁欲">を合理的なものとして誇っていることへの憤りゆえであった Its just amazing how and where you get to "re"discover yourself. It always leaves me questioning about myself and the world, which I kinda like it haha. May be I should read プロテスタンティズムの倫理と資本主義の精神 for the start. Also, the book draws an analogy between 一般的等価形態 and Hobb's 社会契約説. The 社会契約説 seems to explain the underlying assumptions of today's world which I am unaware of, taking it for granted. Might be good to take a look at リヴァイアサン as well. By the way, I'm thinking of going to this tomorrow. I hope I now have a better understanding of surrealism, able to appreciate them a bit😅, after reading this book.
From how far? by Ryo
I'm preempting this book for now to read this book, its shouldn't take too long. The reason is somewhat descriebed as below... われわれの意識や感性、感覚、価値観、思考といった、普通われわれ一人一人が"自分のもの"であると信じて疑わないもののなかに、資本主義がどのように入り込んでいるのか...資本主義社会のなかに現に生きているわれわれが無意識的に自明のものとして見てしまう事象が、この人類史的視点のフィルターを通して見られると、相対化され、決して自明ではないものとして現れてくる...そのような...批判の...テクストとしての"資本論" ...related to the book to some extent. 歴史が予見不可能だというのは嘘である...確かに見通すことができるのは、未来の一般構造だけかもしれない。しかし実を言えば、一般的構造だけが、過去や私たちにが理解できる唯一のことではないか。だから、もしあなたが自分の時代をはっきり見ようと願うならば、遠くから見るべきなのだ...クレオパトラの鼻が見えなくなるちょうどその距離からである With that being said, seems like I'm a kind of guy who can't stand being aware of unaware haha. われわれはそれでも無自覚でいられるだろうか By the way, I'm listening to this song repeatedly these days🎵.
アメリカ文学のレッスン by Ryo
The book was great giving lists of novels, describing how they can be characterized and fits in the context of "American". And there are couple of books that was introduced which I thought might be good to read in the future. - ライ麦畑でつかまえて - カッコーの巣の上で - キャッチ=22 - 見えない人間 I would definitely read "Inivisible Man", maybe I'll try others as well, but all the above I'm interested in Richard Powers, a novelist introduced at the very end of the book. In the epilogue, the book gives some advice for how and what can one expect from reading books, as below. 自分の読み方について考える時には、相手に自分を活性化してもらうという肯定的な発想にせよ他者を消費するという否定的発想にせよ、とにかくそうした非対称的な発想以外の道はないか考えてみることはできる Richard Powers is introduced as where we can find such 非対称性 in relation between 自分 and 他者 in his novels. パワーズという作家の大きな特徴は、世界を思い描く上で、意味づける自分と対象、自己と他者、というふうに非対称的な関係を根底にそえるのではなく、自分と対象<...対象が一枚の写真であれ、一人の他人であれ、第一次世界対戦であれ...>との関係がまずあって、刻々と変化していくその関係から、そのつど自分と対象とが分泌されていく And I believe such experience described as below are those moment when we become aware the 対称性 of today in relation to all the other times in the course of history. いわゆる"近代文化"-が、自らを決定的であるとする思い込みこそ、視界に生じた信じがたい頑迷さと狭隘さではないのか、という漠然とした直感がその根底に見出される。そしてそのように感じる時、私たちは自分たちが狭く閉ざされた場所から逃れ出て、再び星空の下に立ち、最善のことも最悪のこともすべてが可能な、真正で深遠で、恐ろしく見通しのきかない底しれない世界に出たのだという、えも言われぬ印象を持つのである Also, it should be the kind of relation which E.H. Carr describes as below. 過去は現在の光に照らされて初めて知覚できるようになる。現在は過去の光に照らされて初めて十分理解できるようになる By the way, I found out that Richard Powers is graduate of UIUC. I wonder if can go back to school and take his English courses haha.
I Don't Care 🎵 by Ryo
Its after I started reading this book that I realized that its similar to this book, although I haven't read it yet, in a sense its about characterizing the society at the time. With that being said, and keeping in mind that the book was written in 1920s, it's interesting that the book describes what the basis use to be for people claiming their rights, which seems to differ from today's society of "singularity". むしろ現代(1920s)の特徴は、凡俗な魂が、自らを凡俗であると認めながらも、その凡俗であることの権利を大胆に主張し、それを相手かまわず押し付けることにある Note that I haven't read the book, so I might be totally wrong, let's see. But the book is still interesting itself finding out how the author lived in 1920s observed his society back then. Personally, I would rather once again take it as an ideal than taking it for granted ignorantly :) 普遍一般の人間個人の主権に関する理念や法的理想だったものが、いまや(1920s)...一つの心理状態へと移行したのだ And there is this moment that you discover what used to appear as 必然, in other words 心理状態, was one of mere possibility, reducing to a matter of choice, and everything starts to seem possible... - added as of 2025/06/19 いわゆる"近代文化"-が、自らを決定的であるとする思い込みこそ、視界に生じた信じがたい頑迷さと狭隘さではないのか、という漠然とした直感がその根底に見出される。そしてそのように感じる時、私たちは自分たちが狭く閉ざされた場所から逃れ出て、再び星空の下に立ち、最善のことも最悪のこともすべてが可能な、真正で深遠で、恐ろしく見通しのきかない底しれない世界に出たのだという、えも言われぬ印象を持つのである .. maybe because of the below reason. すなわち私たちの生とは、瞬間ごとに、そしてすべてに先立って、自分にとって可能なものについての意識であるということなのだ By the way, I can somewhat see myself in the song, don't know how I can fit in at this "party". Like nobody's lookin' me in my eyes and everyone's got so much to say. But I'm told that it's where I'm suppose to be. Makes me wonder if I could sneak out the back🎵.
Cities I want to travel by Ryo
Today's post is bit different from what I have been posting lately. The purpose of this post is to leave a note on places I was interested by reading this book, which hopefully I can visit one day. The last chapter of the book is about "utopia". It discusses how the notion of utopia has _not_ changed over time ever since the time of Greece and how it can be characterize by this and that. The first characteristic I was interested by is how lights are homogeneously arranged in utopian society. The book describes that such homogeneous arrangement of light does not create any kind of contrast that is provided by shadow, like found in fluorescent light. The opposite, meaning having contrast, is those that can be found in light bulb. The book interprets such homogeneous manner of light in utopian society as below, which reminds me of what Foucault was discussing. トーマス・モアの"ユートピア"には照明のことは書かれていなかったと思うけれども、生活には闇の部分がなく、隅々までも監視が行き届いているという意味では、大体の古今のユートピアはどれも基本的にいわゆる明るい社会なんです With the above being said, the books says that people of Paris once gone against such use of light. パリ・コミューンという1871年の革命のときに...民衆が闇をかえせと叫んで、パリの街灯をひとつひとつ壊して歩いたという And the city I want to visit is Prague as the book says its one of the city in Europe which contrast created by light is beautiful. 点々とオレンジ色のオレンジ色の街灯のならんでいるヨーロッパの町で、もっとも街灯の美しい町のひとつとしてプラハを挙げるならば、そこでは光と影がじつにみごとな起伏にとんだ空間を作り出している。歩くと自分の影がいっしょに動いてゆく Another characteristic that I found interesting in utopian society is its preference over linear arrangement of a city. Its interesting how those linearity found in Greece can be interpreted as "Rationale" ... たとえばアテネはずいぶん奇妙な町です...規則性と反復性の傑作といっていいパルテノン神殿が立っている...あの植谷雄高でさえ、パルテノン神殿に地中海の理性を感じたと記憶します ... and how its different from those linearity found in Pyramid in Egypt and other places. もちろん直交性を持った都市は以前からありました...たとえばエジプトのルクソールに行くと、神殿そのものが直線的ですから、まわりの道もほぼ直線になっていいます...ミレトスの直線は神によって与えられた直線ではなく、人間の(合理的)直線なんです And lastly, the book mentions how the linearity can be interpreted in a context of Orientalism considering "Rationale" as a Western representation. One such example the book gives is the city of Miletus in Turkey, considering how Miletus was neighboring "Asia" back when there was a Persian Empire. The book draws a contrast between Europe and Asia by considering the "Rational" as Western, against "Asia" described as below. そのころにプラトンが登場したんですね。彼には守るべきものがあったわけです。それは、ギリシアが既に高度に推しすすめていた理性というものです...それを象徴する幾何学的に構成された都市...ミレトスに...アジアが侵入してくるのが怖かったんですね。ここで言うアジアというのは、広いアジア的なものです...規則性、反復性がない...エキゾティックで...得体の知れない魅力的なもの Maybe I should read this book in regards. Also, back to how lights are arranged in utopian society, its interesting how Asian cities are getting more utopian today where it was "Asia" that represented the very opposite. Its interesting by how those nature found in the listed cities are still able to be seen in the very society that I live today. And if I were to consider "today" as a point in a history as just like those society once used to be, I see something within those cities that I can associated to myself. Its interesting that the very nature seems to stay the same over time, in fact I can still see them in The Hunger Game haha. The books also shares how those terms like Fantastic, Féerique and etc differs each other. I wonder which term is appropriate for describing Midnight in Paris. Maybe Fantastic? Please let me know if you can tell, because I can't yet😂. That's it for today's post. I hope I can write a post like this more often. See you in the next! --- Diary --- I went to Hakone today and it was such a great trip. Just wanted to keep a note so that I can remember haha.
On being aware of social matter by Ryo
This is a short note for myself, somewhat related to the reason why I want to read Society of Singularities. I haven't read the book yet, but I believe there is an attitude prevalent in such society, which attitude I am aware of my very self, something like below described in the book. "あれかこれか"の決断が迫られる状況は忌避される。さまざまな対立に主体的に関与するのというのではなく、多様性が強調される It could be about any kind of social matter, such as this against that. And I believe there needs at least some kind of attitude towards to make discussion meaningful. With that being said, I feel like its an responsibility of mine as one taking part in society to be aware of issues around the world and having my own attitude towards them. And the below quote from Wright Mills well states what I have in my mind in regards. 私は客観的で(objectvive)であろうと努めてきたが、コミットしてこなかった(detached)つもりはない By the way, I applied for the next year Masters tickets hoping as a gift for the coming father's day. Let's see if I can get one😉
中立とは何か by Ryo
This is the review, or rather my takeaway, of the book. I want to go over the book by quoting the two lines found in the book from E.H Carr. The first quote below, I believe, reflects the very argument that was repeated in the book... 過去は現在の光に照らされて初めて知覚できるようになる ... which is below. The above quote well points out that there always is a perspective, and its the perspective(現在) that allows us to look at(知覚) the past. 世界に起こることは無限であり、なんらかの意味づけをしなければ、それ自体に意味はない。どの事実をどのように整理して理解可能にするのか...事実は一定の観点に関係づけられてはじめて事実として浮かび上がる The second quote, from E.H Carr as well, is given as below. 現在は過去の光に照らされて初めて十分理解できるようになる Note that its not 知覚 as in the first quote, but its 理解. As far as I understand, the point is that we can only understand ourselves(現在) when there is a past that allows to place and study ourselves in relation to. The books wraps up with below line. I think the kind of discussion is needed, not just on the matter of 中立, but to really any subject out there in the world. この終章で考えたいのは、中立を強く求める、そうした時代についてである。さまざまな分野を横断して、なぜかこの時代に支配的になっている雰囲気を問題にしたいと思う。今日の雰囲気はいつの時代にも変わらず存在してきたものではない Which leads me to question the world that I see today, and its the question that I feel is the most interesting one out there.
Interesting how it differs and changes over time by Ryo
It's interesting how an idea could be interpreted differently by people living in a different society or time in the history. The book shares couple of examples. One such example is Ando's perspective on 価値自由. 自分の観点を、他の対立する立場とのコンステレーション(布置連関)に位置づけて、可能なかぎり明晰に自覚化しようとする意識も希薄になりつつある。第一章で価値自由の暫定的な説明をしたときに、ウェーバーはいくぶん古い新カント派の価値哲学のヴォキャブラリーを引き継いでいると述べた。彼が使う価値という用語が古いことは否定できない。しかし、これらを古いと思うとき、私たちは一体、何を見失いつつあるのか。少なくともこの点を自らに問いかける必要はあるだろう。思想史の仕事の一つは、歴史的コンステレーションに今の時代を位置づけることである。価値というタームの意味がわかりにくくなっているとすれば、それが熱心に論じられていた時代から、現在を照らし直す必要がある。今この時代に安藤を読むということには、そうした意味がある Another is Odaka's interpretation of "事実をして語らしめる" within his translation given as below. まことの教師ならば、教壇の上から聴衆に向かってなんらかの立場を-あからさまにしろ暗示的にしろ-強いるようなことのないように用心するであろう。なぜなら、"事実をして語らしめる"というたてまえにとって、このような態度はもっとも不誠実なものだからである The interesting part is that how his mis-translation, or rather should be said his mis-emphasis on "事実をして語らしめる" reflects his attitude against what and how society treated "fact" as fact back then under war. I guess his obvious("自明") was a product of such time in history which lead him to emphasize "事実をして語らしめる" as the way he did. I believe there is an insight into what means to live in a society by looking at how one could be unaware of the "obvious" where he places all the basis of the discussion. 多くの誤訳は、訳者が自明だと思っている、その足元で生まれる。尾高が"事実をして語らしめる"という箇所に"たてまえ"という語句を挿入し、かなり無理をしてこの表現を肯定的な意味に転換してのには、"事実をして語らしめる"というスタンスに肯定的な場所を用意しておきたい、という彼なりの学問の理解があったはずである...イデオロギー的な議論が罷り通り、事実を基礎にした議論ができないという危機意識を彼が持っていたとしたら、そして事実を基礎にした議論をすれば非合理的な戦争遂行を抑制できると彼が信じていたとすれば、"事実をして語らしめる"というフレーズに最大限の強調点をおいたとしても、まったく不思議ではない Speaking of having different perspective, there was another interesting example in the book, which I believe is not because of any kind of "mis-" like in the Odaka's case, but rather something fundamental. The book discusses in the context of "新自由主義" back then in this regards. 事実はなんらかの観点や思想のフレームワークなしには事実にならない...そして事実だけでは学問ではない...この点では、ウェーバーその人とハイエクの違いはほとんどない...ハイエクがウェーバーと異なるのは...ウェーバーは価値自由的な学問を前提にする限り、学問によって体制の選択ができるとは決して考えなかった(沈黙)...これに対してハイエクの学問が沈黙するのは、正しい理論をできない少数の変わり者に対してである...価値自由を論じる時の一つの論点は、価値自由的な学問が個人の決定・決断を拘束する力をどれだけ持つと考えるのかという点にある。学問によって政治的な決定・決断の余地がかぎりなく"一択"に狭められると考えるか、あるいは学問は決定・決断を前にしてはほぼ無力だというくらいに、非合理的な"飛躍"を強調するのか...新自由主義者たちの価値自由論は前者の類型の極端なケースである It might sound little off the topic from what I wrote above, but I see analogy in the Faucault's study on morality back in Greek, Rome, and Cristian society, given how discourse on sexuality has changed over time. I won't quote here(around p208), but its interesting how those sexual customs back then can be understood considering the ethos of each society. I found this book which seems to follow all these discussion of whatever I just wrote above. I assume the book is about looking for those traces of morality in the characters appear in Greek literature which provides insights into the world that we live today. It might be interesting to look at. By the way, the song makes me want to learn Spanish, while I'm aware that the song is in Portuguese. It's Portuguese right😅? --- follow up as of 2025/06/09 --- Another interesting reference to how countries, namely German and America, accepted Wieber's 価値自由 differently and how it has changed over time in America. マックス・ウェーバーはその没後、ドイツでは急速に忘却されていく...忘却という表現は、必ずしも適切ではないかもしれない。ウェーバーの著作からナチズムへと至る放物線を思い描きながら、彼の思想に対して警戒感を持ち続けていたというほうが、より正確な記述ということになるだろう...その基調にあるのは、自然法の観念を相対化するウェーバーの政治理論への強い警戒感であった...これに対して、アメリカの受容は...方法論への関心は、当初のアメリカでのウェーバー受容では、それほど高くはなかった...方法論への関心の低さは、受容する側のアメリカの知的な雰囲気のほうに原因があると考えるべきである。方法論を論じるということは、それまで当たり前に行われてきたことの当たり前さを問うということである...共通了解の動揺やそれに対する懐疑が比較的弱かったということ...資本主義とデモクラシーへの信頼が安定して存在しているところで、深刻な方法論的な問い直しが求められることはなかった...このような状況が変化してきたのは1960年代だった...ウェーバーの方法論的な著作...がアメリカの知的世界でクリティカルな意味を持つのは、黒人の公民権運動などの人種問題、エコロジーの問題、そしてベトナム戦争の泥沼化に直面した、1960年代後半の危機の時代になってからであった...ウェーバーの方法論的な著作がアメリカで再発見されたのは、こうした文脈であった
¡Hola, Mundo! by Ryo
By the end of my 20s, I want to travel to those Latin American countries, and I came to think that learning language and being able to immerse myself in the culture of my favorite must be quite a experience. It could be literature, paintings, music, or random chatting with local people. Whatever that might be, you will be able to experience by your very self. Just imagine how much of a world opens up by learning a language!
Session by Ryo
I was watching this movie and made me want to write about this book, which I wasn't really think of writing about it. To start, people may have different opinion on the movie, but I personally I liked it. Its about a kid who immersed himself in jazz, and a professor who just keep pushing the kid until he breaks. And I can kind of relate myself to this kid as I think I have this tendency of getting lost in my own world, unable to see the other possible choices. And this I believe can be said to various aspects in life, but here I will discusses in terms of jobs quoting from the book as below. 組織が不安定になっても、社会のなかにおける"職業"という軸をしっかりしていれば、そこから距離をとり、職場のなかでの仕事を茶化したりズラしたりすることができます。"ポスト日本型雇用社会"における茶化し/ズラしのためには、組織の安定に左右されない、社会のなかにおける仕事="職業"という考え方が必須で、それこそ、現代日本において、かりあげクンのように"軽やかに"いきるための条件なのです And what I like about the books is that it extends this way of "humorizing" to the life itself, finding the common ground in the way how the people lived back in Soviet Union. 後期社会主義では...彼らは、権威的な言説を茶化したり、骨抜きにしたり、新しい意味を与えたりしながら、一見抑圧的な体制の下にありながらも、"軽やかに暮らし""とても楽しい生活をしていた"のです...かりあげクンは、堅苦しい会社の仕事から"超越(ヴェ二)"した存在で、作品では、彼が、"軽やかに暮らし""とても楽しい生活をして"いる様子が描かれます。彼は、後期社会主義のソ連に生きていた人々と同じく、"システムの内部にいてその一部として機能しながら同時にその枠外の別の場所にいる生き方"(ユルチャク)をしていると言えるでしょう Note that I do _like_ my job, but it can't be all that's out there, so as every other things in life. Also I occasionally get lost in those books I read, makes me feel deadlocked and little discouraged, which is kind of paradoxical as they are suppose to help me figure out those lingering question of mine. Maybe his "軽やかさ" is exactly what I need now in my life haha. By the way, I like jazz and listening to them makes me want to appreciate the world just as it is, not sure myself what that suppose to mean though😂. There is a nice jazz bar in Shinjuku, which I haven't visited for a while. Hope I can visit the place once again during this summer.
Note on Wertfrei, again by Ryo
A while ago, I quoted Hideharu Ando's description of 価値自由. There was a follow up on how his personal experience during the war had lead him to study the idea, and I wanted to make a note of it. It discusses the conditions on how one can be critical on something, and how his personal experience is tied to his study as below. 事実と価値の分離が可能になる条件は、一つの現実に一つの、その現実を正当化する価値がへばりついているという状態からの離脱である。一つの現実(事実)を異なる観点(価値)から把握する可能性がなければ、そしてそうした異なる、複数の観点がそんざいするということを真剣に受け止めたうえで自分と社会を考察するという構えがなければ、ウェーバーの方法論はまったく意味をなさない。安藤はこのことを軍隊生活とその後の研究生活で考え続けた。彼が価値自由を、自分自身の生き方の問題、そしてエートスの問題として引き受けたのも、このためであった And it continues as following, which I see interesting correspondance between Foucault's study unraveling the conditions for those human science came to exist at first place. 安藤の価値自由論は、学問論であると同時に、学問に先立つ前提を批判的に問い直そうとする理論である。無批判にある一定の前提で思考しているかぎり、目の前の、所与の社会秩序を相対化することはできない。このような場合には、wertfrei な態度は現状追認にしかならない。別の言い方をすれば、現実から距離をとって批判的に考察することができる、強い主体、ないしそれを可能にするエートスがなければ、目の前にある現実から自由になることはできない。安藤の読解では、ウェーバーの学問論と宗教社会学が独自の仕方で連結している I would like to queue the book for the next, but there are already few awaiting in the line, let's hope it wont get stalled for too long haha.
フーコー入門 by Ryo
I finished reading the book. I wasn't really thinking of writing another post about the book but I changed my mind. The book says that Foucault once mentioned about his role as below. 人々が、自分で考えているよりもはるかに自由なのだと教えること、人々が自明で真理だと信じているいくつかのテーマが、歴史の特定の時点に作り出されたものであり、このみかけの上での自明性は批判し、破壊することができるものだということを示すことです。それが知識人の役割です。 And I realize that the books, not just his but all those other books as well, are playing this very role for me. It also mentions about the questions that he was trying to answer, and I share the same perspective on the kind of questions that needs to be answered, which is listed as below. - 主体の条件 - どのような知を"真理"として構成し、それを"真理"として確信するのか - 歴史的な条件のもとで、どのような条件において、ある対象が知の対象となりうるか - 主体は真理を獲得したと考えることで、どのような満足と権力を獲得するか Despite how complicated they all sounds, I believe its just saying think yourself, and books will help along the way😆. And I actually find it's something quite interesting to think about. By the way, I always find myself feeling strange yet peaceful like I'm back home listening to those songs from childhood. The song must had been played a lot on the radio back then haha. Its nice to have some place, photos, songs, or really anything you can find peace within🎵.
Note on Wertfrei by Ryo
I'm back reading this book. Little note on the difference between 没価値 and 価値自由(Wertfrei) put it into my own words as a reminder for my own sake. The book quotes Hideharu Ando's description of 価値自由 as below. And how it differs from 没価値, which is more close to the seemingly objective notion of 中立, is what I want to emphasize. "ヴェルト・フライハイト"とは、価値理念や価値判断をできるだけ鮮明に(とりわけ自分自身に対して鮮明に)させることによってそれを自覚的に自己統制することを意味する The book continue as below ... 研究者が主体として価値とどう向き合うかが、安藤にとって重大な問題関心であった。自分の価値理念を自覚化することのない主体は容易に周囲の空気に流される...没価値的な学問はこのような主体のあり方と結びつきやすい ..., and I think this is not just something applicable to academic approach, but also to us regarding how we see the world considering that we are placed in our own unique situation. I remember that the book mentions about the origin of moral as Latin's mores and how its fragile which changes over time and society in the history, something like described as below in the book. エートスは"住み慣れた場所"を意味するギリシア語のἦθοςに由来し、"習慣"や"性格"を指す言葉である。もちろんエートスは倫理(ethics)の関連語でもある。しかし両者には違いもある。倫理ないし倫理学は、思考によってある程度まで整合的に考えられた理論のことである。これに対してエートスは、そうした理論とゆるやかに結びつきつつ、ある時代のある社会集団に共有され、彼らの行為を導くような、習慣化された倫理的態度を指す。エートスはラテン語のモーレス(mores)に対応する。 And I wonder what's out there that I could to do considering what I wrote above, and books seems to be a good place to start with ;)
Little bit of this and that about the books from the past and present by Ryo
Hi, here's another book review! I still haven't finished the book yet but I would like to summarized my short take away from it. I won't write all the details as I wrote a lot about it in the past posts. I would just say there was a lot of idea that I was seeking at the moment, and as of this moment. Again, its nice to have them put into words. Even though it was little discouraging and indeed suffocating as quoted below😂. フーコーの権力の分析が深まっていけばいくほど、生の可能性が失われていくような印象すら受ける。権力的な関係のうちでの抵抗の可能性が失われ...権力的な網の目に絡まれとられてしまうような理論の運びである...近代的な社会がまず規律的な権力の社会として捉えられ...社会にふさわしい身体と精神をもつ主体が構成される...これは息がつまるような理論である Also, it was interesting to see the book referring to Louis Althusser as I remember reading his book while I was in college. Seems like I'm coming back and forth haha. Another interesting reference I found is that the book which I just started reading mentions about how its based on Foucault's this and that book. Although I'm still not yet familiar with the idea of discours(言説), I'm willing to take a look into those books so that I can see how it can be apply to Orientalism. Maybe later, once I catch my breathing :) Lastly, there was this quote in the book about the seemingly neutral notion of Orientalism disattached from political discussion. "真の知識"が基本的に非政治的であるとする一般的でリベラルな多数意見というものは、知識の生み出される時点でその環境としてある、たとい目には見えずとも高度に組織化された政治的諸条件を、いかにして覆い隠すものとなっているのか。本書が明らかにしようとしているのはその点である I see the statement is also very true in today's everyday world, and I believe its something that we should carefully consider what kind of knowledge that we are dealing with. Again, this is something that I recognize from Max Weber's Wertfreiheit(没自由). And I'm looking forward to see how the book untangles the seemingly neutral notion of Orientalism as said below. "インドやイギリスに関するあらゆる学問的知識は、総体としての政治的事実によって何らかの意味で色付けされ刻印を押され侵害されているのだ"ということとは...本書でオリエンタリズムに関して私の言わんとするところなのである...なぜなら、人文科学におけるいかなる知識の生産であれ、その著者が人間的主体として周囲の環境に巻き込まれている... That's it for today's post! I wonder if there might be some insights into how Japan is portraited in today's tourism, which I kinda like it haha.
These days by Ryo
As I think more and more, I occasionally get this depression having hard time seeing value or faith in those things that considered to be a priori in life, feels like nothing left to believe in to start with. Sometimes its hard to keep my heads up... Maybe I must have a faith and start thinking the kind of changes that I may be able make. --- wrote as of 5/25 --- Isn't this the very question that I am trying to ask myself, and the very reason that I am willing to learn, so that I can live with little bit of confidence ;)
Random thoughts during lunch break by Ryo
Little note on my thoughts while I was reading this article. I noticed that people involved in the situation covered in the article fits into the picture discussed in this book. The book discusses how America has changed over time, which resulted in society getting more deterministic in terms of their course of life, given their social and economic backgrounds. Considering how such current situation has been shaped over time and the fact we are at least placed in one of such situation of our own, it makes me wonder how where in the society which I belong to has came to be created. By the way, I think its important that you put your feelings or those intangible idea into words at that very moment, it's hard to come back and put them back together once its lost.
Why read books? by Ryo
I wasn't able to put the reason for why I go after books in my own words, despite I am well aware of the urge. But I found a line in this book which articulates this urgency on behalf of me. 思想は抽象的な知の体系ではなく、現実の生き方を問う倫理的な営みとしての意味を持つものだった More accurately, or rather specifically, added as of 2025/05/20, the above can be rephrased as below for me. 様々な仮構的な主体概念を前提として分析するのではなく、その社会のなかで、このようなディスクールを真理として信じる主体(me)が、どのようにして形成されるかを分析...いかにしてその社会に適合的な主体として形成されていくか With the above said, the books I read is more than just some theory in an academic kind of sense. It gives me the reasoning that I look for in life, as said in the below line from this book. 価値をめぐる対立について、学問は一義的な解を与えることはできない。しかし、決断の手前のところで、あるいは決断へと至る過程の重要なところで、貢献できることが学問にはある And I guess this is all because I recently came to be aware of something described as below. ある人が社会の中で生きがたく思う時に、思想はその人が直面する問題を解決する手段となり、社会を変えていくために役立つべきである But yet I still have no clue what the "better" direction for this world to head. I guess there remains a lot for me to study😅. By the way, I recently wonder there might be things in life that themselves can be appreciated, those things that might not require any kind of reasoning. Maybe the memory from your childhood or the feeling you experience when you like someone.
Random thoughts from last night by Ryo
Books occasionally provokes this sense of feeling that I'm more of a object(客体) of interest which needs to be studied within the context of the society(社会) and the history(時代) that I live in, leading me to lose the sense of subjectivity(主体). I think this sense of feeling is what keeps me thinking, questioning, and reading etc. I think below line from this book describes the idea. 自然のことものを対象とする物理学や化学のような学問とは異なり、学問の対象が同時にその主体であるために、厳密な科学性に到達することができないことにある I believe there is some idea shared among the above and below line from this book in terms of subjectivity. I also see something similar in the discussion of Wertfreiheit(没自由) by Max Weber. May be I'm wrong though. 人間には感情や自己の利益に左右されずに、合理的に判断を下すことのできるための能力がそなわっている...判断という活動そのものの力で独自の原則を作り出すことができる But at the end, if we were a product of the society and history we live in, isn't those society and history that we should be studying to understand ourselves? --- a little insight into what I wrote above as of 5/14 --- There must be a condition for such question to arise explaiend as below in the book . 近代の知の大きな特徴は、考古学的な変動によってこのまなざしと表の空間が崩壊し、そこに生身の人間が登場することである。人間は"知にとっての客体であるとともに認識する主体として、その両義的な立場において登場する"。 If the above can be said, there is where the question comes in. "純粋理性批判"においてカントは、批判哲学はコペルニクス的な転換を意味すると誇ったが、これは人間の知が人間の認識の有限性によって初めて根拠づけられるという確認であった...すなわち、人間の認識と知の真理の根拠は、人間が物自体ではなく、現象しか認識できないという認識能力の有限性そのもにあるとされたのだった。 --- another follow up as of 2025/05/19 --- I wondered if I should write this as a new post, but I'll write this as a follow up for this post. The line below is from the book. 真理とは、誰がそれを真理として信じるかによって、大きく意味を変えるものであり、思想を真理として信じる主体の分析なしには、真理そのものの概念を分析しても、意味がないことになる And it discusses about the nature of "the" truth as following. <本質>がどのように歴史的な経緯によって真理として形成されたのかを分析する...真理という概念は、この歴史性を隠蔽して、なにものかの"本質"であるかのように振る舞うものである And it describes "the" truth as following. 真理とは論駁されないという特徴をもつ誤謬にすぎず、歴史的な価値をもつものにすぎない And I agree with the above statement, as far as my understanding, which is for the reason described by the following statement from the book. 個々の主体から離れた真理というものはなく、真理はつねに一つの視点からみられなければならないこと示すものである But at the same time, if I were to place myself in a such mere existence relative to society and history, I get little discouraged that I feel there is no value in such notion of being "myself"😅. This book might be the one for me to take a look at next.
What I mean by "better" by Ryo
This is a short follow up to the last post. I occasionally use the term "better". I thought it might be a good idea to clarify what I mean by the term when I use in this blog as I believe it can deliver so many things when used depending on the context. Let me first state that, jumping to the conclusion, I try to keep the word "better" within the extent of technical sense. What I mean by that is that the word "better" I use is not based(to the extent that I'm aware of) on any kind of "argument" of mine. I think the below quote from this book gives the sense of idea which I have in my mind. 彼(ゴルトシャイト)からすれば、資本主義経済のネガティブな作用が顕在化する中で、より"人間的"な経済を主題化し、その方向で"進歩"を語ることは、混乱しているどころか、極めて筋の通った議論に思えたはずである。しかしウェーバーからすると、"人間的"というのはあまりにも多義的である。これについて一義的に進歩を論じることはできない。ゴルトシャイトにとっての"人間的"という評価は別の人にとってはそうではないかもしれない。別の人は別の基準で"人間的"を論じる可能性があるし、実際そうしているかもしれない。 But with the above said, there is this below quote that I found in this book. And if I were to make any kind of "argument" regarding "progress", it would be something similar to his. Maybe I will take a look at his book for the next. And yes, there also is this book that I bought quite a while ago that is still piled up in my room. Maybe now is a good time to revisit the book. 歴史の進歩とは、自らの責任を問われ必要のないことで負わされる"不条理な苦痛"を減らすことだ - 市井三郎 By the way, listening to this song while I play around with the DSLR from my college years make me feel things are still the same... Am I just being nostalgic or I actually haven't made any kind of progress ever since😅?
Good Morning by Ryo
My thoughts on learning by Ryo
Hi, there was this book that I bought a couple of months ago and was being piled up among other books😅. I took up and have been reading for about a week and I want to share the ideas and some of the lines. Note I haven't read the entire book yet. I may come back and forth and write about the book sporadically. As stated in the intro, this blog is about what I learn, thought, or felt in everyday life. And I found below quote from the book that I think it well states what I'm trying to deal with. もちろんちゃんと"勉強"すれば、一つの答えが手に入るという場合も少なくない。むしろその方が多い。その地点までは人は"勉強"すべきであろう。しかし、人生にとって大事な問題ほど、答えは一つにならない。 Given the above statement, I believe the answer should be in the attempt and the attempt can be in such processes described as below. 私たちはそれぞれの状況で、異なる見方をする誰かと遭遇することで、その都度、違いとその理由を認識する...他者との出会いを通じて、自分が今このときに考えていることについて反省的に考える。こうした経験なしには、私たちは自分の考えを認識することができない...一定の議論と反省のプロセスの結果として、価値は輪郭を現す...そして同時に、いろいろな局面で自分にとって自明であった見方が修正や訂正を必要とすることに気づく。 And I above is what I mean when I say "learn". And this is where reading books comes into my "learn"ing as stated below. 価値をめぐる対立について、学問は一義的な解を与えることはできない。しかし、決断の手前のところで、あるいは決断へと至る過程の重要なところで、貢献できることが学問にはある。 That's it for today's post! By the way, I recently found that Norah Johes is visiting Japan. I always liked her songs and may visit Osaka for the first time.
Thoughts on Career by Ryo
Recently, I was watching this documentry. It reminded me of this image of myself that I used to had until college. I used to think that I will be working overseas just like any other people around me traveling and working abroad. I didn't expect that I'll be spending all day every day playing around with computers😅. There are couple of lines that I would like to quote from this book that I was reading. Maybe career is just an aggregate of accidental and coincidental events, full of unexpected turns, but they better be, in my opinion, result of something stated below by Inazō Nitobe. 己のいる場所、就ける職業、周囲の要求する義務を、如何に小さくとも、如何につまらなくとも、全く己を尽くし… I believe the above statement can be translated into more broader statement below by Uchimura Kanzō. われわれに後世に遺すものは何もなくとも、われわれに後世の人にこれぞというて覚えられるべきものはなにもなくとも、アノ人はこの世に活きているあいだは真面目なる生涯を送った人である… Maybe job is simply one of many means to an end to the above statement. At the end, something relate to what I took out from 責任と判断, I think its all about what one considers to be 人の人たる道 and live by accordingly. By the way, I used to listen to this playlist while I was in college. It still reminds of those nights with all my homework submitted and just waiting for their due of midnight to come without any kind of stress. It was such a peaceful time haha.
Responsibility and Judgment (for now) by Ryo
Hi, Today I'll be summerizing this book which I have been reading for about 2 months. I haven't yet read all the second chapter "Judgement" but I thought I should write about the book for now anyway because I thought the chapter one "Reponsibility" was more or less what I have been concerning recently. Maybe I'll come back to the second chapter someday in the future. The book was really worth reading. I'll leave the details of some of popped up thoughts while reading the book to the past posts but the gist of *my* take out is that it gave me a sense of idea what responsible means in respect to to the extent how free we are(please correct if I were wrong). It's that if we were to believe in such freedom, there is a responsibility that we should acknowledge. I can somewhat relate this to Sartre saying his existentialism as "Humanitarian". Believing in such "freedom" leaves little hope in being "man" myself. One more, little off the topic, the book mentions about a boy in p457. It makes me wonder what all these years I will live(d) will mean to me. I have no clue to the question, but for now, I just hope I can live by believing in such freedom and being aware of the entailing responsibility. By the way, while I repeat Every Summertime, seems summer is almost there.
Thoughts on Language by Ryo
This post will be about little bit of this and that. First I will write about the book that I'm reading right now up to the Chapter One "Responsibility". Let's start by quoting my favorite sentence from the the book as usual. 人間にとっては、過去の事柄について考えることは...自分の根を見出し...時代精神や歴史や単なる誘惑などの出来事によっても押し流されないようになる Related to above statement, one interesting fact that I learned about is that the word "conscience"(良心) stems from "consciousness"(意識). Back in time, the words weren't really distinguished as "conscience" were considered something that comes from "consciousness" as result of being aware of one's self, which implies being aware of what one considers to be good or bad. どんな言語でも良心という語は、もともとは善と悪について知り、判断する能力を指すものではなく、私たちが今意識と呼ぶもの、すなわち私たちが自らを認識し、自覚する能力を指すものでした As I think more and more, it does make sense that the fact those two words weren't distinguished, and still in some language treated as the same. Speaking of language, I was watching this documentry on a episode about translator and below I quoted something that I can relate to myself as of now writing this post. 鍵になりそうな言葉は、ごく基本的な単語でも書き出し、最もふさわしい訳語を見つけていく Currently, I don't have much chance to write English, or even Japanese, but I always try to find the *right* word which conveys the idea that I have in my mind. I always try to be accurate in that sense, not only when I'm writing, but also when I'm reading. Back when I was in college, I used to read Tolstoy or Dostoevsky and I really wanted to get on the originals just because I believed that there are some context that gets lost in translation. Nowadays, I'm little(very) lazy and I'm always reading translated books and making no effort in broadening my vocabulary for my writing(Note that I do spend considerable amount of time for those occasional writing that I do for patches and emails for Linux kernel😂). I'm also well aware that this blog that I write in English doesn't make much sense other than myself. Maybe I should start reading more books in English. That's it for todays post :)
Tupac by Ryo
Listening to Tupac makes me feel I'm no longer young in a sense that I am responsible in one way or the other just by taking part in a society. I like the feeling that there actually is something, no matter how trivial that might be, that I can take part and be responsible. Let's see if I can figure this out😉.
絵画を読む <イコノロジー入門> by Ryo
Hi! Today I'm writing about this book which I have been reading during lunch break😁. I occasionally mentioned that I have been interested in painting on this blog. This book adds some aspect in how paintings can be perceived *given* historical, religious, etc contexts. Its interesting how the object within the painting can be interpreted differently depending on the contexts. The book gives a couple of paintings as an example, but my definite favorite was the ”潔白の寓意” by アニョーロ・ブロンズィーノ. Also, its such an interesting subject to think about the reasoning behind the first impression you get from paintings. Maybe the impression we get(experience) through paintings doesn't change throughout ages and transcend the value at the time. I think the below quote articulates the point I'm trying to make. It describes the reasoning behind the difference in the impression we get from Impressionism and Expressionism. どんなに主観的な感覚が強調されたとしても、多くの場合、印象派の絵には安心感がある。感覚によって世界は色んな見え方をするとしても、世界そのものが混沌としたカオスであり無秩序であるということは、基本的に想定されていない。逆に言えば、表現主義が出てくるのは、秩序に対する一定の信頼が失われ、人々のあいだで”同じ一つの世界”を共有することが難しくなり、このため自分の内なる”体験”を世界に対して押し付けるしかなくなるからである...表現主義を絵画を観て、不安な、心もとない気持ちになるのは、この意味では当然である - マックス・ウェーバー-近代と格闘した思想家 By the way, fortunately or unfortunately, I recently realized that below is so true😅. 恋はうつくしかろ、孝もうつくしかろ、忠君愛国も結構だろう。然し自身がその局に当たれば利害の旋風に巻き込まれて、うつくしきことにも、結構なことにも、目は眩んでしまう - 草枕
Some recent random thoughts by Ryo
I might be too naive, but I’m starting to think that below might be the only magic that will remain after all. At the end, its all about what you believe in, and the point is you get to choose what to believe in. If there's any kind of magic in this world it must be in the attempt of understanding someone sharing something. I know, it's almost impossible to succeed but who cares really? The answer must be in the attempt. - Before Sunrise
Responsibility and Judgment by Ryo
Today I'm writing about this book, as I mentioned in the last post. But this post will be only covering the 1st and little bit of 2nd chapter as I'm still reading the book. Its really worth reading books that addresses the questions that I was trying to ask myself. Sometimes, often these days, books helps me to articulate those questions that have been lingering without being clearly stated. But that doesn't mean that those question has been answered, it only means that I now have a firm grasp of what the question that I'm trying to answer. Below quote might be somewhat related. 懐疑や疑念は、物事を吟味して、自分で決心するために使えるのです...自分のうちの自己とともに生きなければならないことを知っている She also mentions in the book about to what extent man is responsible for his/her judgment as below. Believing in such statement gives some kind of hope but it entails the responsibility at the same time. And it is such responsibility that I hope that I am "capable" of taking. 政治的な問題と道徳的な問題に関しては、服従などというものは存在しないからです...この問題について考え抜いてみれば、私たちはある種の自信と、ときには誇りをもてるようになるでしょう Related to the first quote, there was a below line from this movie. Well, I'm no wise but have a lots of doubts... And I believe what matter is that I figure out my own answers to those doubts along the way. You are wise, because you have doubts By the way, I'm thinking of trip to Europe to see my family. It's been a while since I last traveled abroad, last time was India. I wouldn't be traveling if not for good reason so I'm very looking forward to make this trip happen. I would really like to visit those paintings that were addressed in the book and visit places seen in some of my favorite movies.
Some Thoughts on Job by Ryo
Hi, today I'm writing about some of the thoughts that came across while I was reading this book. Note that I'm sure that I will be writing about the book once again in the future as so far I found the book really worth giving thoughts into, especially on some of the topics which I have been thinking regarding to what extent one can be responsible living in a society. But I'll leave that topic to the next post and will write about my thoughts on job for this post. Let me start with quoting from the book. What I found so interesting about the below quote is that because I was't aware of the the kind of reasoning judicial systems are based on and how the judge at the time concluded as such. 判事たちが大きな努力を払って明らかにしたことは、法廷で裁かれているのはシステムではなく、大文字の歴史的な傾向でもなく、何とか主義でもなく、一人の人間なのだということでした。 I believe the below quote describes the very foundation of the belief behind such decision, and I also believe(hope) that below holds true. 人間には感情や自己の利益に左右されずに、合理的に判断を下すことのできるための能力がそなわっている...判断という活動そのものの力で独自の原則を作り出すことができる Back to the topic, the reason I found the first quote so interesting is that because it shows how we can bring(contribute) what each of us believe to be good to society through job. It make me wonder what is it that matters to me the most and what kind of contribution am I making to this world. By the way, as you might have guessed from the past posts, I love music. They somehow provokes, or rather amplifies the emotions and brings me back to the time when I was listening to those songs. They also provoke some dreamy thoughts like where I want to be in the future. Listening to those kind of songs makes me wonder what its like to work in New York✈️. Maybe its only a daydream, but I'm sure I will keep daydreaming of that day working in New York while listening to those songs😅. That's it for today's post.
What Is Enlightenment? by Ryo
Hi, Today I'm writing about this essay by Kant. Its a short one but I found many relatable subjects in other books. First let me start by quoting from translator's postscript. 私たちの多くが、すでに経験してきたように、何事も親まかせ、他人まかせであった少年期を出てようやく青年期に入ろうとする頃は、自分の心に様々な疑問が粉起し、しかもこれをなんとか自分に納得いくように解決しなければ満足できない時期である。...そこで私達が眼前の諸問題を”自分で考える”ために、本書に収めたカントの労作を手引きとするならば、これらの諸論文は、若い人達に、”啓蒙”の役割を果たしてくれるに違いないと思うのである。 The enlightment(啓蒙) used here is, as far as I understand, is very similar to what is refered as "Entzauberung(魔法が解ける)" by Max Weber, as explained in this book. As I try to see through things, I occasionally find that things actually does not make sense either that could be a value that I used to hold or the way things are in society. When I realize that whatever I use to hold no longer have a ground within myself, I find "myself" clearer, but at the same time I find myself "What is it then that I can hold on to?". I'm not sure wheather if that's related to what Kant refers to as "Sapere aude", but I do believe in the process of learning and having better understanding of things, which is "Entzauberung" if I were to used the expression. I'm no smart by any means but I always hope that I can believe in what I belive to be right or wrong. And I believe its only possible because, although I know that there are still a lot more to learn, I'm at least trying(to my best) to have better understanding and figure out how things are. As of now writing this post, I'm listening to "Fine By Me" by Andy Grammer. I found the sond very heartwarming and it lifts off some of the weight off my shoulder for some reason. I'm just listening to the song over and over haha. That's it for today's post!
The Great Gatsby by Ryo
Hi, today I'm writing about my favorite novel, The Great Gatsby by F. Scott Fitzgerald. I read the book for the first time very long time ago. I'm writing this now because it came across while I was reading some books and this documentry. The book have been my favorite just because I only liked the character of Gatsby😅. But while I was reading this book, there was below which describes what the novel was trying to convey, what we can take out from the novel. フィッツジェラルドもギャッツビーとデイジーに託して相克する二つのビジョンの物語を書く。そして高度化する資本主義社会の空虚さに目を向けながら、かつての理想の喪失を語ろうとするとき、この二人の眼差しは交差する。 I wasn't aware of the contrast it was trying to depict, which is the world(or value) before and during the 1920's of America. It makes me feel strange(little sad one?) when such a contrast "can" be depicted so clearly over two "individual"s. It reminds that I'm part of society, I'm no exception. Which makes me wonder what is like to be in a society, the kind of society that am I living. Below is a quote from this book that I'm reading right now. Althought the book is about paintings, I think the same can be said to novel, as it conveys the essense of the time and society the author is living, and we can see his or her individuality living in that society. いかなる純粋絵画であっても、時代と文化の文脈を逃れることはできない。...すぐれた作品には必ず解釈ができる。すぐれた作品とは、画家の精神の中枢から創造されているからである。 By the way, thinking of such things makes me a little curious if AI can create an art😆. In my opinion, wheather that be a novel or painting, I think its only possible if AI could become an individual living(experiencing) in a society, meaning that having the experience that is truely unique to that AI just like us living in the same society but different life. I think such an uniqueness as individual is what makes art an art. That's it for today's post!
Hello 2025! by Ryo
Hi, Today I wanted to make a brief post, its new year! Let's start with some tech stuff that I hope to do this year. Threre are many things I want to do related to Linux kernel, as always :). I'm currently enjoying studying locking, scheduler, interrupt and defferring related subjects like softirq. There are mostly related to preemptivity and I found it such an interenting and complicated(in a fun sense) to look into. Printk is a subsystem that I found quite interesting that involves all of what listed. Lets see how it goes😆. And most importantly, I found that taking part in the community is the exciting part and where I learn the most, and I just really want enjoy it! Secondly, speaking of more in general, I hope I can be more honest to my dreams, opinion and essentially to myself. I often feel lost and confused unabled to sort things out, leads to some kind of loneliness something that I have to face, "only" I can face. But note that its not anxiety that I am feeling. I found below quote while I was reading this book as something that I can relate to. No power transcending man can make a moral claim upon him. Man is responsible to himself for gaining or losing his life... no one can help him but he himself. (Man for Himself) I'm not sure if this is something that can be get rid of, but reading books and thinking to myself and having my point of view clearer gives some sense of direction and confidence in living life. For me, honesty comes from having such sense of direction that I can truely believe and living accordingly. Maybe it's because I always keep telling myself "Why'd you have to go and make things so complicated?"🎵. This might sounds a lot but essentially I just simply want enjoy what 2025 has to bring. See you in the next post!
Giving some thoughts on books by Ryo
Hi! Today I am sharing some of the books I read this year which struck me, those I found worth giving thoughts into. - Z世代化する社会 by 舟津 昌平 - マック・ウェーバー 近代と格闘した思想家 by 野口雅弘 - 知ってるつもり 無知の科学 by スティーブン・スローマン・フィリップ・ファーンバック - 二十世紀と格闘した先人たち by 寺島 実郎 I learned many things trying out new things, meeting new people throughout the year. When you get out, you will learn something better than you used to, or maybe you will realize that there exists some aspects in things that you didn't even know that existed. One thing that I believe import is that you know what you know, and more importantly, knowing what you don't know. There are always things that you take it for granted, assuming(never even bother to think about) that always stands true. It could be a knowledge in science or a value you hold in which shared among the society you live in. The books I listed above gave me some insights into how I am perceiving the world, and how "I" believe the world should be perceived. Being aware of where I stand in the society, the value I am holding, or the job I am given and thinking how I am taking part in the world is something that I feel responsible. I want always to be grateful for the people around me, never stop learning and be aware there are still a lot more to learn about out in this world, but at the same time, why not Thank heaven for little illusions which makes this world a little more hopeful and beautiful place to believe in ;). By the way, although I'm always on Linux kernel, I might be writing more of book reviews and less tech stuff haha.
2024 by Ryo
Hi! As the end of this year is almost there, I'm writing some of the stuff that came across my mind reflecting over this year. I was reading an article about snoopy last week, as Charles M. Schulz's birthday was November 26, and I learned this "Oh Good Grief!" and what it is trying to convey. 『ピーナッツ』は子どものダメ、できない、困ったという心の悩み、葛藤をどう乗り越えるかを一貫したテーマとし、それは登場人物が頻繁に発する「Good grief」(やれやれ、困った、お手上げだよ)という台詞にも現れている。 quote from wikipedia If I were to summarize this year, it was a year full of "Oh Good Grief!" moment. I had this moments in both in job and social life, might had more in social life though. Everytime I encountered this "Oh Good Grief!", either in job or social life, I tried to accept the result(how it turned out) as they were all result of choices made by myself. But things can't be overcame so easily haha. I was either lingering on regret or trying making sense out of the mistakes. One thing I learned(at least what I take it for now) is that its not always about coming up with solution, but its about facing it and understanding more clearly how things are. It might not solve the issue, but at least you will have better understanding of the situation you are in which gives you better insight into how you should face it. Now I'm 26, which for some reason makes me feel I should be more responsible for whatever I do😉. Luckly, working on Linux kernel and being part of it, however small the contribution might be, makes me feel at least I'm make this world a little better place. I know there are more to think about, but its something that I should always keep in mind that its so greatful to have such thing in life.
Best kernel for audio? by Ryo
Hi! I wanted to share something that I have been looking into related to Realtime kernel. RT kernel is a kernel which aims to achieve low latency for process scheduling. One of its application is audio and I'm trying to see how it benefits from RT kernel. Below is the setup that I'm currently working on. Machine: Mac M2 (which I bought it recently, it runs on Linux😆) Audio Editor: Ardour Although I'm still trying to understand how Ardour and audio input devices work, today I went to my friend's place who plays guitar to see how it works. It was quite intersting to see his setup, especially the audio interface which converts sound signals from guitar into digital bits so that PCs can do interesting suff (please correct me if I were wrong...). I am not yet ready to do any kind of testing(benchmarking?), but my guess is that higher the frequency you try to capture, you will need a kernel with a lower latency! By the way, besides playing around with guitar, Today I made a strawberry pi for the first time. I tasted ok but yet there remained a room for improvement. Maybe I can give another try next week😋. See you on the next post!
Hello, world! by Ryo
Hi, I just wanted to make a brief post (its new year). At the end of the last year, I was on travel to India, the country I always wanted to visit since college(couldn't due to covid). During the trip, I had a serious food poisoning. But I still consider it was a great trip(even though I still haven't had curry ever since I got back) and I am already looking forward to the next trip to India(喉元過ぎれば熱さ忘れる). I had a good time giving time for myself to think about this and that. Throughout the last year, I was trying to figure out this and that, and I believe now I at least have a direction. And I just feel so greatful, given the chance to pursuit what I want.
Process vs Thread by Ryo
Hi, recently I have been looking into how user processes are prepared. Today's post is about the how user process and thread are being prepared in terms of allocated memory.
When a new process or thread being created, it calls clone system call. If you want to create a thread, you can pass CLONE_VM flag to the system call. One of the difference between a process and thread is that wheather it shares its memory space or not. The latter does but the former does not, and today's post is about looking into this difference.
In order to see the difference, I prepared a program which ① the parents process assignes a variable with 5, and ② the cloned child process rewrites the variable with 10. The difference mentioned earlier can be seen at the ② point.
Let's first see how the process looks like. Below shows that the PID 1628 is the parent and the 1629 is the child.
  crash> ps | grep clone
       1628    1601   0  ffff94fd4a271c80  IN   0.1     2628     1336  clone
       1629    1628   0  ffff94fd4123b900  IN   0.1     2628      884  clone
  crash>
Now let's take a look at the physical address correspoding to the variable's virtual address which is 0x404068. You can see the corresponding physical address is 17bfe068. As expected, the value at the address is still 5 as the child process does not share the address space.
  crash> vtop -c ffff94fd4a271c80 404068
  VIRTUAL     PHYSICAL
  404068      17bfe068
  ...
  crash> rd -p 17bfe068 10
          17bfe068:  0000000000000005 00000000014b72b0   .........rK.....
          ...
  crash>
However, if you take a look at the threading, you will see the varible is now changed as the child shares the same address space and rewrites the variable.
  crash> ps | grep clone
       1714    1601   0  ffff94fd44e2d580  IN   0.1     2628     1396  clone
       1715    1714   0  ffff94fd41291c80  IN   0.1     2628      964  clone
  crash> vtop -c ffff94fd44e2d580 404068
  VIRTUAL     PHYSICAL
  404068      1161e068
  ...
  crash> rd -p 1161e068 10
          1161e068:  000000000000000a 00000000004c32b0   .........2L.....
          ...
  crash>
That's it for the today's post. Note that I used x86 for this experiment as vtop on arm64(below) did not work. I wonder why🤔. Might be fun looking into it.
 crash> vtop -c 11884 aaaae706c84c
 VIRTUAL     PHYSICAL

 vtop: invalid structure member offset: mm_struct_mmap
       FILE: memory.c  LINE: 4007  FUNCTION: vm_area_dump()

 [/usr/bin/crash] error trace: aaaae706c84c => aaaae706456c => aaaae7101180 => aaaae71010ec

 vtop: invalid structure member offset: mm_struct_mmap
       FILE: memory.c  LINE: 4007  FUNCTION: vm_area_dump()

 crash>
The Very First Process by Ryo
Hi, I wanted make a post on how the first process gets initiated as I have been playing around with qemu recently. Specifically, I will describe how the parameters below lead to the /sbin/init, which has the pid of 1.
admin@ip-10-0-16-6:~/busybox/busybox$ qemu-system-aarch64 -M virt -cpu cortex-a72 -m 1024 -kernel /boot/vmlinuz-6.1.0-13-cloud-arm64 -initrd /home/admin/busybox/busybox/rootfs -append "root=/dev/ram0 rdinit=/sbin/init nokaslr" -nographic
Let's start with the source code. After the kernel finishes the initilization of this and that, it gets ready for the first process and calls rest_init. The function inits the rest and calls kernel_init, and then run_init_process gets called.
Now back to the arguments and see what it's doing. If you take a look at the man page of initrd, it says that -initrd gets uncompressed onto the /dev/ram0, which then mounted as the inital root file system. Here I found little confusing is that if you specify root as /dev/ram0, the initial root file system, which is /dev/ram0, will remain as the normal root file system.
Let's make sure that the first run_init_process is the one being called for initiating the first process in the case of using /dev/ram0 as the normal root file system. Here you can see that the execute_command has /sbin/init, the program specifed by rdinit from the normal root file system which now is the /dev/ram0.
   (gdb) print ramdisk_execute_command
   $1 = 0xffff00003fdf0196 "/sbin/init"
   (gdb) print execute_command
   $2 = 0x0
   (gdb)
By the way, don't forget to specify "nokaslr" for the boot parameter. Otherwise, break points won't work😑. That is it for this post!
Studying Kprobe by Ryo
I have been trying to understand how systemtap works. And I want to share some of the things I studied about systemtap, or kprobe which systemtap uses internally.
When you register a handler through kprobe, it inserts brk instruction at the specified offset from the chosen symbol as shown below. You can find the sample program I used for testing kprobe here.
┌──(kali㉿kali-raspberry-pi)-[~/proper-version-name/dumpable-kernel]
└─$ sudo crash ./vmlinux
crash> dis cpus_are_stuck_in_kernel
0xffffffe9258290a4
Once it reaches the brk instruction, it triggers an el1 synchronous exception. In the case of brk instruction, EC will set to 0x3C and will call el1_dbg.
Where I found interesting is how brk_handler gets called. When I was first reading the source code, I thought brk_early64 is the one which gets called. However, tracing the functions showed that brk_handler is the one which was actually being called. Note that some of the functions doesn't appear because they are inlined...
  ┌──(kali㉿kali-raspberry-pi)-[~/systemtap/kprobe_observation]
  └─$ sudo trace-cmd report -i trace.dat | grep "kexec_\|kimage_\|cpus_are_stuck_in_kernel\|do_debug_exception\|early_brk64\|do_bad\|brk_handler\|debug_exception_enter\|debug_exception_exit"
  ...
              kexec-1060  [000]   246.092881: function:             do_debug_exception
              kexec-1060  [000]   246.092884: function:                brk_handler
In addition, I found that the entry for the early_brk64 is replaced with brk_handler🤨.
crash> rd debug_fault_info
ffffffe926d6a168: ffffffe925831fe4 ...%....
crash> struct fault_info ffffffe926d6a168 10
fn = 0xffffffe925831fe4
If you trace back the brk_handler, you will find how this replacement happens. During the initialization, trap_init replaces the early_brk64 with brk_handler for the reason which I haven't found yet... That is it for today's post!
Tracing and Tapping Kernel by Ryo
When I was trying to kexec on my RPI4, I had trouble loading the image. I remember that in order to diagnose the problem, I inserted bunch of printks to understand what was going on. Today I am writing about these 2 tools I recently started looking into which are used for debugging, maybe not just for debugging, called trace-cmd and systemtap.
Recalling back when I was tackling the problem of kexec not loading the image, my first approach was to strace kexec and trace the associated system calls. It looked something like below.
 ┌──(kali㉿kali-raspberry-pi)-[~]
 └─$ sudo strace kexec -l /boot/kdumpv07222023.img --reuse-cmdline
 ...
 kexec_load(0x2c9e6a0, 3, [{buf=0x7ff3c37010, bufsz=22475264, mem=0x1600000, memsz=23658496}, {buf=0x55555b7850, bufsz=55722, mem=0x2c90000, memsz=57344}, {buf=0x55555c57b0, bufsz=13656, mem=0x2c9e000, memsz=16384}], KEXEC_ARCH_AARCH64) = -1 EBUSY (Device or resource busy)
From what the strace above gave me, I started looking into the source code and inserted pritnks to see which functions are being called and what they are returning. Very clever haha🙃.
But now equipped with trace-cmd and systemtap, I think I'm released from this flooding of prinks, Phew... Let's say that I want to know which functions are being called. Considering the above case, I can use trace-cmd to trace all the functions being called and decide which of them might be the one that I am interested in.
  ┌──(kali㉿kali-raspberry-pi)-[~/systemtap]
  └─$ trace-cmd report -i ebusy.dat | grep "kexec_\|kimage_\|cpus_are_stuck_in_kernel"
             kexec-945   [000]   100.885692: function:             kexec_image_load_default
             ...
             kexec-945   [000]   100.886629: function:             machine_kexec_prepare
             kexec-945   [000]   100.886631: function:                cpus_are_stuck_in_kernel
             kexec-945   [000]   100.887281: function:             kimage_free
             ...
When the system call for loading the kexec image is called, it calles either of kexec_load or kexec_file_load. The EBUSY error is returned by its sanity check which is handle by the cpus_are_stuck_in_kernel show above. You can guess that the cpus_are_stuck_in_kernel is the one that we are interested by reading the source code as the subsequent function are not being called.
https://github.com/raspberrypi/linux/blob/rpi-6.1.y/kernel/kexec_file.c#L368
https://github.com/raspberrypi/linux/blob/rpi-6.1.y/arch/arm64/kernel/machine_kexec.c#L70
https://github.com/raspberrypi/linux/blob/rpi-6.1.y/arch/arm64/kernel/smp.c#L1093
In order to make sure that cpus_are_stuck_in_kernel is the one preventing from loading the image, let's take a look at what its return value is. Here we can use systemtap, and below indeed shows the return value is EBUSY(-16).
  ┌──(kali㉿kali-raspberry-pi)-[~/systemtap]
  └─$ sudo stap -v kexec.stp
  Pass 1: parsed user script and 471 library scripts using 115208virt/100712res/6596shr/94160data kb, in 1860usr/360sys/2232real ms.
  Pass 2: analyzed script: 1 probe, 2 functions, 0 embeds, 0 globals using 174920virt/161736res/7860shr/153872data kb, in 6930usr/700sys/7637real ms.
  Pass 3: using cached /root/.systemtap/cache/07/stap_0744f24e121f251cab8e1f8c2089a20b_1355.c
  Pass 4: using cached /root/.systemtap/cache/07/stap_0744f24e121f251cab8e1f8c2089a20b_1355.ko
  Pass 5: starting run.
  machine_kexec_prepare returned -16
  Pass 5: run completed in 70usr/670sys/49763real ms.
I feel that what systemtap does is soo magical. And I'm not really comfortable using magic... Next I might look into how systemtap does its magic💡.
perf and Interrupts by Ryo
Hi! Today's post is about perf which is a tool I recently started looking into. perf monitors hardware/software events and is used for performace analysis. I have only started looking into the tool and haven't yet explored what its capable of but I will share something I found interesting about the tool for this post.
If you take a look at how perf collects hardware/software events, you will find that there is a hardware(Performance Monitoring Unit) dedicated for monitoring the system. PMU sends interrupts to check in the time(?) spent on CPU at function level. Here I will share the result of "perf top" on RPI4(arm64).
Samples: 10K of event 'cycles', 4000 Hz, Event count (approx.): 291421676 lost: 0/0 drop: 0/0
Overhead  Shared Object               Symbol
  16.40%  [kernel]                    [k] _raw_spin_unlock_irqrestore
   7.16%  [kernel]                    [k] finish_task_switch.isra.0
   7.14%  [kernel]                    [k] arch_counter_get_cntpct
   4.03%  [kernel]                    [k] _raw_spin_unlock_irq
   3.60%  [kernel]                    [k] _raw_read_unlock_irqr
And here is the result of "perf top" on Optiplex(x86).
Samples: 10K of event 'cycles', 4000 Hz, Event count (approx.): 297333264 lost: 0/0 drop: 0/0
Overhead  Shared Object                  Symbol
   4.45%  [kernel]                       [k] native_sched_clock
   1.88%  perf                           [.] dso__find_symbol
   1.64%  perf                           [.] io__get_char
   1.61%  perf                           [.] rb_next
   1.59%  [kernel]                       [k] menu_select
   ...
One thing to note here is that you can see _raw_spin_unlock_irqrestore is spending a lot time on RPI4(arm64) unlike Optiplex(x86). If you recall that currently arm64 does not support NMI-like inturrupt, it's clear that why perf is showing such high overhead for _raw_spin_unlock_irqrestore.
Below shows the RPI4(arm64) and Optiplex(x86)'s interrupts triggered by PMU which is used for collecting data shown on "perf top". As Optiplex(x86)'s PMU uses NMI unlike RPI4(arm64), whenever it interrupts, its the exact function that is currently running at the moment. However, in the case of RPI4(arm64), the interrupts generated by PMU has the same priority as the currently runnning interrupt and needs to wait until it releases by calling _raw_spin_unlock_irqrestore.
┌──(kali㉿kali-raspberry-pi)-[~]
└─$ cat /proc/interrupts
           CPU0       CPU1       CPU2       CPU3
...
 29:       4111          0          0          0     GICv2  48 Level     arm-pmu
 30:          0       6871          0          0     GICv2  49 Level     arm-pmu
 31:          0          0       3374          0     GICv2  50 Level     arm-pmu
 32:          0          0          0        533     GICv2  51 Level     arm-pmu
ryo@ryo-OptiPlex-3020:~$ cat /proc/interrupts
           CPU0       CPU1       CPU2       CPU3
...
NMI:       7723       9494       7256       6888   Non-maskable interrupts
...
PMI:       7723       9494       7256       6888   Performance monitoring interrupts
That's it for this post. It's fun to take a look at different architecture other than arm64. It helps to deepen your understanding of cantain features(like interrupts) by making a comparison🧐.
I also wanted to share that I decided to make the memos private. Instead, my plan is to make posts more often here on this blog, See you on the next post!
Exception, by NULLポインタ dereference by Ryo
Hi, today I will be posting about exceptions which is the subject I found very fun and interesting as it requires a good understanding of hardware along with the linux source code. I've yet only started exploring the subject but I'll share some of the stuff I've learned so far.
There are many situations that can trigger an exception such as system call, packet reception, etc... But for this post, I will specifically focus in the case of null pointer dereference😏.
As the MMU translation fault is an synchronous exception, it referes to the table and calls el1h_64_sync.
Whenever an exception is triggered, it saves the state of registers by storing them on the stack and passes the sp to the subsequent functions. You can see how el1h_64_sync stores the registers on the stack here.
  crash> disas el1h_64_sync
  Dump of assembler code for function el1h_64_sync:
     0xffffffe8e681121c <+0>:     stp     x0, x1, [sp]
     0xffffffe8e6811220 <+4>:     stp     x2, x3, [sp, #16]
  ...
     0xffffffe8e6811278 <+92>:    mov     x0, sp
     0xffffffe8e681127c <+96>:    bl      0xffffffe8e739f080
After el1h_64_sync has done its job, in the case of null pointer dereference, it calles el1_abort by refereing to the ESR reigster which is 0x25. Then el1_abort refers to this table defined as fault_info which is used to trigger the appropriate handlers based on ESR register. The handler will be called based on the offset from the fault_info. In the case of Null pointer dereference, do_translation_fault will be triggered.
  crash> sym fault_info
  ffffffe833bcb000 (d) fault_info
  crash> sym do_translation_fault
  ffffffe833bae0b4 (t) do_translation_fault
  crash> rd ffffffe833bcb000 0x20
  ffffffe833bcb000:  ffffffe8330377a0 0000008000000009   .w.3............
  ffffffe833bcb010:  ffffffe833e18a80 ffffffe8330377a0   ...3.....w.3....
  ffffffe833bcb020:  0000008000000009 ffffffe833e18a98   ...........3....
  ffffffe833bcb030:  ffffffe8330377a0 0000008000000009   .w.3............
  ffffffe833bcb040:  ffffffe833e18ab8 ffffffe8330377a0   ...3.....w.3....
  ffffffe833bcb050:  0000008000000009 ffffffe833e18ad8   ...........3....
  ffffffe833bcb060:  ffffffe833bae0b4 000000010000000b   ...3............
  ffffffe833bcb070:  ffffffe833e18af8 ...
After the call of do_translation_fault, it simply calls functions accordingly. One thing to note is that once it gets to die, you can see that it won't panic unless you enable CONFIG_PANIC_ON_OOPS. That's it for this post! I will be digging deeper into this subject and might be sharing them here as well✍️.
Backtracing 101 by Ryo
Hi, last post I made was about "task_struct" which is used to manage tasks and I wrote little bit about how stacks are associated. In this post, I will share how to read a stack to trace the functions being called from a register being dumped at the moment of panic.
Here is an example of a dumped register that you will see in the event of panic. The registers of interest are frame pointer(x29) and program counter(x30).
  [  340.163740] pc : machine_kexec+0x44/0x200
  [  340.163757] lr : machine_kexec+0x44/0x200
  [  340.163773] sp : ffffffc00a963b50
  [  340.163782] x29: ffffffc00a963b50 x28: ffffff80bc6f3e00 x27: 0000000000000000
  ...
  [  340.163982] x2 : 0000000000000000 x1 : 0000000000000000 x0 : ffffff80bc6f3e00
In ARM64, whenever you branch(bl) to a new function, the instruction below gets called. It stores the fp and pc at the address where sp plus offset points to. As a result, fp is pointing at the address of the previous frame and it enables to track frames in a linked list fashion.
stp x29, x30, [sp, offset]!
Now let's take a look at the actual stack. I won't dump the entire stack👾, but take a look here if interested.
If you start from ffffffc00a963b50(X29), you will get a list of fps shown below.
   ffffffc00a963b50
   ffffffc00a963b80
   ffffffc00a963d10
   ffffffc00a963df0
   ffffffc00a963e00
   ffffffc00a963e30
   ffffffc00a963e70
   ffffffc00a963e80
   ffffffc00a963ea0
   ffffffc00a963fe0
   0000000000000000
And as you can see from the stp instruction, the return addresses which points to the functions that we are intrested in, are on the stack right next to the fps. If we trace the addresses on the stack next to the fps and look up the associated functions, we get the backtrace.
  crash> sym ffffffdefb15fa74
  ffffffdefb15fa74 (T) __crash_kexec+164
  ffffffdefbb8dd14 (T) panic+444
  ffffffdefb0aaef0 (T) __arm64_sys_p4ni9+64
  ffffffdefb029a60 (t) invoke_syscall+80
  ffffffdefb029b9c (t) el0_svc_common+108
  ffffffdefb029c98 (T) do_el0_svc+56
  ffffffdefbb9b9d4 (t) el0_svc+48
  ffffffdefbb9be28 (T) el0t_64_sync_handler+244
  ffffffdefb011548 (t) el0t_64_sync+396
As you can see, this trace show that the panic was triggered by an user space exception. For the next post, I will write about how excpetions are triggered and how they work😉.
Having fun with "crash", Looking into task_struct by Ryo
Hi, I have been working on kernel dump which works after the call of panic(). Along the way, I learned a lot about kernel basics and I decided to share some of them here as my memos are getting quite messy.
For this post, I will share how kernel manages tasks using the structure task_struct. You can find the source below.
https://elixir.bootlin.com/linux/latest/source/arch/arm64/include/asm/thread_info.h#L24
Here is an example of the task "Softwar~cThread" running at the moement of panic. You can see the struct task_struct has an address of ffffff805ea4be00 given at "TASK".
   crash> bt -c 1
   PID: 2132     TASK: ffffff805ea4be00  CPU: 1    COMMAND: "Softwar~cThread"
    #0 [ffffffc00800bd60] crash_save_cpu at ffffffdefb15ff60
   ...
If you look at the definition of task_struct, there are some members that might be interesting to take a look at. The member that caught my attention is stack which points to the stack for the task.
 crash> struct task_struct ffffff805ea4be00
 struct task_struct {
   thread_info = {
     ...
   },
   __state = 0,
   stack = 0xffffffc00a110000,
If you take a look at the memory where the "stack" points at, you can see the exact stack at the moment of panic.
 crash> rd ffffffc00a110000 0x1FFF
 ffffffc00a110000:  0000000057ac6e9d 0000000000000000   .n.W............
 ffffffc00a110010:  0000000000000000 0000000000000000   ................
 ffffffc00a110020:  0000000000000000 0000000000000000   ................
 ...
 ffffffc00a113f90:  0000007f5869bfa0 0000007f5eb5e100   ..iX.......^....
 ffffffc00a113fa0:  0000007ff7c1d8a8 0000007f5eb5e100   ...........^....
 ffffffc00a113fb0:  0000007ff7c1d8d4 0000000080000000   ................
 ffffffc00a113fc0:  0000007feb8f2194 0000000000000062   .!......b.......
 ffffffc00a113fd0:  0000000000000000 0000000000000000   ................
 ffffffc00a113fe0:  0000000000000000 0000000000000000   ................
 ffffffc00a113ff0:  0000000000000000 0000000000000000 rd: invalid kernel virtual address: ffffffc00a114000  type: "64-bit KVADDR"
 crash>
One thing that I could't figure out is that I don't see thread_info at the bottom of the stack. I read a lot of articles explaining that each stack has a thread_info at its bottom... Maybe I should look deeper into how tasks are scheduled and stacks gets prepared😎.
Kernel Crash Dump by Ryo
Hi, I wanted to share something that I have been working on along with the networking stack, kernel crash dump. The reason why started working on the subject is because I quite often got stuck on debugging kernel panic and I need a tool besides inserting bunch of printks😅.
Along the way, I tried many different approches I found online and I finally made a kernel with functioning kexec in the event of kernel panic. Here is the source code that I prepared for ARM64(Raspberry Pi 4).
https://github.com/ryofslife/dumpable-kernel
You can find the details of implementation and all the researches that I have done here.
https://scrapbox.io/ryozioput/
I removed some parts of the code from the original source and added a system call which triggers a kernel panic for testing the kexec rebooting of the loaded kernel.
Besides the coding, I will share some of the tunings that you have to do if you want to enable kexec on Raspberry Pi(quad-core, 4GB RAM).
First, you have to make sure that you have reserved enough memory for the loaded kernel. You can check memory info on /proc/meminfo and estimate how much memory your system will need. If the memory you reserved was too small, it will hang and never boot up. For my system, 512MB was enough to get away with the boot up process. You might need more if you are running additional processes after the boot up.
 ┌──(kali㉿kali-raspberry-pi)-[~]
 └─$ dmesg | grep crash
 [    0.000000] crashkernel reserved: 0x000000000ac00000 - 0x000000002ac00000 (512 MB)
 [    0.000000] Kernel command line: coherent_pool=1M 8250.nr_uarts=0 snd_bcm2835.enable_headphones=0 snd_bcm2835.enable_headphones=1 snd_bcm2835.enable_hdmi=1 bcm2708_fb.fbwidth=1824 bcm2708_fb.fbheight=984 bcm2708_fb.fbswap=1 smsc95xx.macaddr=E4:5F:01:D3:5B:D9 vc_mem.mem_base=0x3eb00000 vc_mem.mem_size=0x3ff00000  console=ttyS0,115200 console=tty1 root=PARTUUID=59536845-02 rootfstype=ext4 fsck.repair=yes rootwait net.ifnames=0 crashkernel=512M maxcpus=1
Another tip is that kexec did not work on multi-core mode at least on Raspberry Pi 4. Some of the changes that I made on the source code is that I disable the check against the number of running cores so that it can load the image regardless of the number of cores on the system. You can see that the maxcpu is set 1 on the above log from the dmesg.
I learned a lot from the process of preparing kexec and I enjoyed it. Kernel crash dump is such an insteresting subject, and I might be digging deeper into it👾.
Replying to ARP requests by Ryo
Hi, today I wanted to make a short post that I now have a working kernel built-in ARP(reply) stack😎. Although the stack can't yet handle ARP request, my stack is now able to receive packets from local peers! Here are the output showing the windows sending arp request and raspberry pi (my stack!) replying to the request.
 C:\WINDOWS\system32>arp -a

 Interface: 192.168.10.2 --- 0x8
   Internet Address      Physical Address      Type
   192.168.10.1          fc-99-47-12-26-7a     dynamic
   192.168.10.255        ff-ff-ff-ff-ff-ff     static
   224.0.0.22            01-00-5e-00-00-16     static
   224.0.0.251           01-00-5e-00-00-fb     static
   224.0.0.252           01-00-5e-00-00-fc     static
   239.255.255.250       01-00-5e-7f-ff-fa     static

 Interface: 172.21.176.1 --- 0x2b
   Internet Address      Physical Address      Type
   172.21.179.85         00-15-5d-4a-0e-39     dynamic
   172.21.191.255        ff-ff-ff-ff-ff-ff     static
   224.0.0.22            01-00-5e-00-00-16     static
   224.0.0.251           01-00-5e-00-00-fb     static
   224.0.0.252           01-00-5e-00-00-fc     static
   224.0.1.60            01-00-5e-00-01-3c     static
   239.255.255.250       01-00-5e-7f-ff-fa     static

 C:\WINDOWS\system32>ping 192.168.10.3

 Pinging 192.168.10.3 with 32 bytes of data:
 Request timed out.

 Ping statistics for 192.168.10.3:
     Packets: Sent = 1, Received = 0, Lost = 1 (100% loss),
 Control-C
 ^C
 C:\WINDOWS\system32>

 ┌──(kali㉿kali-raspberry-pi)-[~]
 └─$ dmesg | grep my_arp_rcv
 [   93.757253] my_arp_rcv(): address of skb 00000000f1642941
 [   93.757324] my_arp_rcv(): address of arp header0000000063ca06a6
 [   93.757349] my_arp_rcv(): sender IP address of 34252992
 [   93.757371] my_arp_rcv(): target IP address of 51030208
 [   93.757391] my_arp_rcv(): the arp requsest is for IP protocol
 [   93.757430] my_arp_rcv(): found matching ip interface
 [   93.757484] my_arp_rcv(): successfully sent an arp response

 C:\WINDOWS\system32>arp -a

 Interface: 192.168.10.2 --- 0x8
   Internet Address      Physical Address      Type
   192.168.10.1          fc-99-47-12-26-7a     dynamic
   192.168.10.3          e4-5f-01-d3-5b-d9     dynamic --> here the entry is added, fc-99-47-12-26-7a is the MAC of pi
   192.168.10.255        ff-ff-ff-ff-ff-ff     static
   224.0.0.22            01-00-5e-00-00-16     static
   224.0.0.251           01-00-5e-00-00-fb     static
   224.0.0.252           01-00-5e-00-00-fc     static
   239.255.255.250       01-00-5e-7f-ff-fa     static

 Interface: 172.21.176.1 --- 0x2b
   Internet Address      Physical Address      Type
   172.21.179.85         00-15-5d-4a-0e-39     dynamic
   172.21.191.255        ff-ff-ff-ff-ff-ff     static
   224.0.0.22            01-00-5e-00-00-16     static
   224.0.0.251           01-00-5e-00-00-fb     static
   224.0.0.252           01-00-5e-00-00-fc     static
   224.0.1.60            01-00-5e-00-01-3c     static
   239.255.255.250       01-00-5e-7f-ff-fa     static

 C:\WINDOWS\system32>
I recently started this service called scrapbox.io for keeping all the notes taken while I build my programs. Below is the link to the note while I was doing some debuggings for this arp reply stack.
https://scrapbox.io/everydaymemo/arpリプライのデバッグ
Building my own networking stack by Ryo
Hi! There is this holiday called Golden Week in Japan. It is a week long holiday and I wanted to share this project I was working on for almost 12/7😅. Its about building your own networking stack from device(using TAP) to socket. It is a great project for those who want to understand how OS networking stack works behind the Linux kernel. Below is the github link I was following along the project.
https://github.com/pandax381/microps
https://github.com/sititou70/klab-protocol-stack-tutorial
I've gone through each stack and it really deepened my understanding of how OS handles data arriving to its physical devices and sending all the way up to sockets assigned to each application. I am thinking of sharing some of the key concepts of each stack and how they passes data to each other in the future posts! For today's post, I just wanted to share a modification that I made from the original program regarding the TCP stack. I enabled the TCP stack to be able to establish a active connection to a server on the internet and fetch some random content. Of course, the established connection can't just abandon the connection😏. It has to participate in the process of terminating connection passively. I modified the code to complete the entire procedure of such TCP connection. Below is the log from the local program, the one uses the DIY network stack.
00:18:18.434 [D] tcp_open_rfc793: connection established: local=192.0.2.2:7, foreign=194.195.86.83:8080 (tcp.c:1172)
00:18:18.434 [D] tcp_output_segment: 192.0.2.2:7 => 194.195.86.83:8080, len=100 (payload=80) (tcp.c:417)
        src: 7
        dst: 8080
        seq: 1804289384
        ack: 3543150099
        off: 0x50 (20)
        flg: 0x18 (---AP---)
        wnd: 65535
        sum: 0x30fe
         up: 0
00:18:18.434 [D] ip_output_core: dev=net1, iface=192.0.2.2, protocol=TCP(0x06), len=120 (ip.c:477)
        vhl: 0x45 [v: 4, hl: 5 (20)]
        tos: 0x00
      total: 120 (payload: 100)
         id: 131
     offset: 0x0000 [flags=0, offset=0]
        ttl: 255
   protocol: 6 (TCP)
        sum: 0xdfe3 (0xdfe3)
        src: 192.0.2.2
        dst: 194.195.86.83
00:18:18.435 [D] arp_resolve: resolved, pa=192.0.2.1, ha=8e:6e:37:e9:d1:92 (arp.c:357)
00:18:18.435 [D] net_device_output: dev=net1, type=IP(0x0800), len=120 (net.c:189)
00:18:18.435 [D] ether_transmit_helper: dev=net1, type=IP(0x0800), len=134 (ether.c:108)
        src: 00:00:5e:00:53:01
        dst: 8e:6e:37:e9:d1:92
       type: 0x0800 (IP)
Data with the size of 80 was sent. Closing the connection.
...
00:18:18.562 [D] tcp_input: 194.195.86.83:8080 => 192.0.2.2:7, len=67 (payload=47) (tcp.c:996)
        src: 8080
        dst: 7
        seq: 3543150099
        ack: 1804289464
        off: 0x50 (20)
        flg: 0x18 (---AP---)
        wnd: 29200
        sum: 0xc768
         up: 0
+------+-------------------------------------------------+------------------+
| 0000 | 48 54 54 50 2f 31 2e 31 20 34 30 30 20 42 61 64 | HTTP/1.1 400 Bad |
| 0010 | 20 52 65 71 75 65 73 74 0d 0a 43 6f 6e 6e 65 63 |  Request..Connec |
| 0020 | 74 69 6f 6e 3a 20 63 6c 6f 73 65 0d 0a 0d 0a    | tion: close....  |
+------+-------------------------------------------------+------------------+
00:18:18.562 [D] tcp_output_segment: 192.0.2.2:7 => 194.195.86.83:8080, len=20 (payload=0) (tcp.c:417)        src: 7
        dst: 8080
        seq: 1804289464
        ack: 3543150146
        off: 0x50 (20)
        flg: 0x10 (---A----)
        wnd: 65488
        sum: 0x029d
         up: 0
...
00:18:18.565 [D] tcp_input: 194.195.86.83:8080 => 192.0.2.2:7, len=20 (payload=0) (tcp.c:996)
        src: 8080
        dst: 7
        seq: 3543150146
        ack: 1804289464
        off: 0x50 (20)
        flg: 0x11 (---A---F)
        wnd: 29200
        sum: 0x905c
         up: 0
00:18:18.565 [D] tcp_output_segment: 192.0.2.2:7 => 194.195.86.83:8080, len=20 (payload=0) (tcp.c:417)        src: 7
        dst: 8080
        seq: 1804289464
        ack: 3543150147
        off: 0x50 (20)
        flg: 0x10 (---A----)
        wnd: 65535
        sum: 0x026d
         up: 0
...
00:18:18.565 [D] tcp_output_segment: 192.0.2.2:7 => 194.195.86.83:8080, len=20 (payload=0) (tcp.c:417)        src: 7
        dst: 8080
        seq: 1804289464
        ack: 3543150147
        off: 0x50 (20)
        flg: 0x11 (---A---F)
        wnd: 65535
        sum: 0x026c
         up: 0
...
00:18:18.689 [D] tcp_input: 194.195.86.83:8080 => 192.0.2.2:7, len=20 (payload=0) (tcp.c:996)
        src: 8080
        dst: 7
        seq: 3543150147
        ack: 1804289465
        off: 0x50 (20)
        flg: 0x10 (---A----)
        wnd: 29200
        sum: 0x905b
         up: 0
Connection is closed passively.
And here is the log from my web server hosting this web site. By comparing the logs, you can see that the TCP 3 way handshake at the beginning actively initiated by the local program of mine. At the end, the server is the one that initiating the termination of the connection as it has finished sending all the data, which in this case is a "400 Bad Request".... I made few modification on the program so that the local program can handle the state transition associated with the active establishment and the passive termination of a connection.
root@ryofslife:~# tcpdump src host 180.56.119.152 -vvv
...
15:18:18.426463 IP (tos 0x48, ttl 233, id 129, offset 0, flags [none], proto TCP (6), length 40)
    p9209152-ipngn9901marunouchi.tokyo.ocn.ne.jp.60320 > ryofslife.com.http-alt: Flags [S], cksum 0xaed7 (correct), seq 1804289383, win 65535, length 0
...
15:18:18.550721 IP (tos 0x48, ttl 233, id 130, offset 0, flags [none], proto TCP (6), length 40)
    p9209152-ipngn9901marunouchi.tokyo.ocn.ne.jp.60320 > ryofslife.com.http-alt: Flags [.], cksum 0xad84 (correct), seq 1804289384, ack 3543150099, win 65535, length 0
...
15:18:18.554528 IP (tos 0x48, ttl 233, id 131, offset 0, flags [none], proto TCP (6), length 120)
    p9209152-ipngn9901marunouchi.tokyo.ocn.ne.jp.60320 > ryofslife.com.http-alt: Flags [P.], cksum 0xdb95 (correct), seq 0:80, ack 1, win 65535, length 80: HTTP, length: 80
        GET / HTTP/1.1
...
15:18:18.679744 IP (tos 0x48, ttl 233, id 132, offset 0, flags [none], proto TCP (6), length 40)
    p9209152-ipngn9901marunouchi.tokyo.ocn.ne.jp.60320 > ryofslife.com.http-alt: Flags [.], cksum 0xad34 (correct), seq 80, ack 48, win 65488, length 0
...
15:18:18.682063 IP (tos 0x48, ttl 233, id 133, offset 0, flags [none], proto TCP (6), length 40)
    p9209152-ipngn9901marunouchi.tokyo.ocn.ne.jp.60320 > ryofslife.com.http-alt: Flags [.], cksum 0xad04 (correct), seq 80, ack 49, win 65535, length 0
15:18:18.682646 IP (tos 0x48, ttl 233, id 134, offset 0, flags [none], proto TCP (6), length 40)
    p9209152-ipngn9901marunouchi.tokyo.ocn.ne.jp.60320 > ryofslife.com.http-alt: Flags [F.], cksum 0xad03 (correct), seq 80, ack 49, win 65535, length 0
15:18:18.683615 IP (tos 0x48, ttl 43, id 54157, offset 0, flags [none], proto TCP (6), length 52)
I am thinking of sharing the code on my github once done fixing little bits and pieces😎. Anyways, wish you all have a great week! See in the next post!!
My latest topology by Ryo
Hi! I have been working on my lab and wanted to share its physical and logical topology. I think I made a huge improvement on the diagram compared to the last one from an aesthetic point of view😎. Here is the logical topology. There are networks connected by BGP and I prepared a local network for each one of them. All the three local networks are reachable from each other as they advertise their local network to their peers. Among the three routers, I installed netem to the VyOS so that I can simulate some of the WAN characteristics like latency and packet loss.
 And here is the physical setup and topology of my lab. I used two L2 switches to connect three routers and to prepare a local network for each of the routers.

 I recently took a simple benchmark regarding bandwidth and latency using this lab setup. It's great have an environment where you can gets your hands dirty😏. See you in the next post!
DIY Ethernet Cable! by Ryo
Hi! I've been running out of cables for my lab and I decided to make one by myself from a 15m CAT 6 ethernet cable which I got from my local store for about $10. I had to make 4 attempts to finally get a working cable and here are the mistakes that I made. Hope it helps someone who is trying to do the same thing😅.
 First attempt, the pin for white/orange wire were not properly attached.
It is also not looking good as the cable sheet is too short for the plug😂.
First attempt, the pin for white/orange wire were not properly attached.
It is also not looking good as the cable sheet is too short for the plug😂.
 Second attempt, I misaligned the blue and white/green wire.
 Third attempt, I realized that I was configuring the order of the wires upside-down respect to the plug🤣🤣🤣.
 And here is the final product!
 Mistakes are proof that you are learning😎. See you in the next post!

Internet & TOR by Ryo
Hi! I wanted to share that my lab is finally connected to the internet! For the last 6 months ever since I got my first switch and router, my lab never had gotten out of its LAN😅. It's the first time getting out of my LAN and interacting with the internet and I'm just sooo excited about it. The reason I decided to extend my lab to the internet is because I have been looking into technologies used over the internet, TOR in particular. I'm learning how relays used in TOR allows clients to hide their identity over the internet and how it helps people in some countries with strict censorship. I found the technology as well as the role it plays in society very interesting. I believe such technology to ensure people have access to learn what is happening around the world is crucial. Having such tool gives us additional choice in what we choose from the pool of sources and I believe it could make a huge different sometimes. I am learning that there are many ways that I can take part in the community and I'm sure there is something that I can do to help people out there! https://www.torproject.org/ By the way, I noticed that my lab topology is getting pretty messy😂. I'm currently working on BGP and I'll share a nicer topology here once I'm done with all the BGP configurations that I have in my mind. See you in the next post!!!!!
L2TP by Ryo
Hi! I have been working on l2tp on my lab and I wanted to leave a tip here as it took me about a week to finally make it work. I'm not sure if the problem that I faced is specific to the device that I am using, namely cisco 892 router, but here is the tip for those working on l2tp.
When you are setting the interface which is used for tunneling the LAN, the one you apply "xconnect", it has to be a WAN interface!
I found this very weird and confusing. Why would you want to use WAN interface for tunneling LAN interface🤣. The below link really saved me as the given answer was exactly the one I needed. Without it, I'm probably still working wondering why ping is not working even though that the tunnel is established and everything seems configured correctly.
Cisco892で, "WANポート"を使わなければL2TP接続した両端の機器間でPing疎通できない
I also used a lot of Switched Port Analyzer(SPAN) for debugging. It's very useful and fun tool for labbing! Below is the topology of my lab after setting up l2tp.
 I have been interested in benchmarking my networking devices for a while and I am hoping to make a post about it within a next couple week. Anyways, see you in the next post!
VyOS by Ryo
Hi! Today, I wanted to share that I installed VyOS on my DELL desktop as I needed additional router for my home lab. I usually install this kind of softwares on Ras Pi but I learned that there is no ARM64 version of VyOS😂. The reason I turned my DELL into VyOS is only because I wanted to try out BGP with physical devices😏. See you in the next post!
GRE tunneling by Ryo
Hi! Today, I wanted to share about the things that I have learned by tunneling between Ras Pi and a router through GRE. At first, I was trying GRE on packet tracer but it didn't work for some reason. So I decided to instead work on physical devices which were available at the moment. I will share some of key commands for setting up GRE on Ras Pi. For the router, you will find many resources online for setting up GRE on a cisco router😅.
┌──(kali㉿kali-raspberry-pi)-[~]
└─$ sudo ip tunnel add gre1 mode gre remote 172.168.10.25 local 192.168.233.204 ttl 255
┌──(kali㉿kali-raspberry-pi)-[~]
└─$ ip tunnel list
gre0: gre/ip remote any local any ttl inherit nopmtudisc
gre1: gre/ip remote 172.168.10.25 local 192.168.233.204 ttl 255
┌──(kali㉿kali-raspberry-pi)-[~]
└─$ sudo ip addr add 10.10.10.1/24 dev gre1
┌──(kali㉿kali-raspberry-pi)-[~]
└─$ sudo ip link set gre1 up
┌──(kali㉿kali-raspberry-pi)-[~]
└─$ sudo ip addr add 192.168.233.204/24 dev eth0
The process of setting up GRE is the same for both Ras Pi and a router, only difference is the commands😎. Once done with the above set up, you have to configure the route for both the physical interface connected to the router and the virtual tunnel interface. Below is the route table.
┌──(kali㉿kali-raspberry-pi)-[~]
└─$ sudo ip route
default via 192.168.85.77 dev wlan0 proto dhcp src 192.168.85.76 metric 600
10.10.10.0/24 dev gre1 proto kernel scope link src 10.10.10.1
172.168.10.25 dev eth0 scope link
192.168.85.0/24 dev wlan0 proto kernel scope link src 192.168.85.76 metric 600
192.168.233.0/24 dev eth0 proto kernel scope link src 192.168.233.204
Here 10.10.10.0/24 is the network for the tunnel and 172.168.10.25 is the address of the router's physical interface connected to Ras Pi. When I was working on tunneling yesterday, I couldn't figure out why ping was failing after setting up the tunnel. It was the route info that was missing🤣. See you in the next post!
IPFire on Raspbeery Pi by Ryo
Hi! Today, I wanted to share that I recently turned my raspberry pi into to a firewall to make it part of my home lab. Here are some notes for setting up IPFire on raspberry pi. When I was setting up IPFire, I got stuck for a little while with a rainbow screen when trying to boot it up.
1. Set "hdmi_safe" to 0 which you will find in config.txt.
hdmi_safe=0
2. Set "SERIAL-CONSOLE" to OFF which you will find in uENV.txt.
SERIAL-CONSOLE=OFF
Hope it helps if any one of you encounters the same issue. Firewall is something that I haven't really looked into and excited about adding new component into my home lab and learning what it is capable of!
EtherChannel and STP by Ryo
Hi! Today, I configured an EtherChannel to see how it affects STP. For the setup, I prepared two switches (Switch1 & Swtich2) and connected them with 2 cables. Below shows how STP is configured on Switch1 before EtherChannel is ready on Switch2.
Switch1(config)#
Switch1(config)#interface range fastEthernet 0/1-2
Switch1(config-if-range)#channel-group 1 mode active //Swtich1はactiveに設定
Creating a port-channel interface Port-channel 1

Switch1(config-if-range)#
Switch1(config-if-range)#channel-protocol LACP
Switch1(config-if-range)#exit
Switch1(config)#exit
Switch1#show
00:11:48: %SYS-5-CONFIG_I: Configured from console by console
% Type "show ?" for a list of subcommands
Switch1#show etherchannel summary
Flags:  D - down        P - in port-channel
        I - stand-alone s - suspended
        H - Hot-standby (LACP only)
        R - Layer3      S - Layer2
        U - in use      f - failed to allocate aggregator
        u - unsuitable for bundling
        w - waiting to be aggregated
        d - default port


Number of channel-groups in use: 1
Number of aggregators:           1

Group  Port-channel  Protocol    Ports
------+-------------+-----------+-----------------------------------------------
1      Po1(SD)         LACP      Fa0/1(I)    Fa0/2(I)

Switch1#
Switch1#show spanning-tree

VLAN0001
  Spanning tree enabled protocol ieee
  Root ID    Priority    32769
             Address     ec30.918e.c100
             This bridge is the root
             Hello Time   2 sec  Max Age 20 sec  Forward Delay 15 sec

  Bridge ID  Priority    32769  (priority 32768 sys-id-ext 1)
             Address     ec30.918e.c100
             Hello Time   2 sec  Max Age 20 sec  Forward Delay 15 sec
             Aging Time 300

Interface        Role Sts Cost      Prio.Nbr Type
---------------- ---- --- --------- -------- --------------------------------
Fa0/1            Desg FWD 19        128.1    P2p
Fa0/2            Desg FWD 19        128.2    P2p
As you can see from the above, since the EtherChannel is still not configured on Switch2, you can see that STP recognizes 2 ports as they are not yet bundled even though the 2 ports are registered on the channel-group 1. Below is how Switch2 is configured after setting up Switch.
Switch1#
Switch1#show etherchannel summary
Flags:  D - down        P - in port-channel
        I - stand-alone s - suspended
        H - Hot-standby (LACP only)
        R - Layer3      S - Layer2
        U - in use      f - failed to allocate aggregator
        u - unsuitable for bundling
        w - waiting to be aggregated
        d - default port


Number of channel-groups in use: 1
Number of aggregators:           1

Group  Port-channel  Protocol    Ports
------+-------------+-----------+-----------------------------------------------
1      Po1(SU)         LACP      Fa0/1(P)    Fa0/2(P)

Switch1#show spanning-tree

VLAN0001
  Spanning tree enabled protocol ieee
  Root ID    Priority    32769
             Address     ec30.918e.c100
             This bridge is the root
             Hello Time   2 sec  Max Age 20 sec  Forward Delay 15 sec

  Bridge ID  Priority    32769  (priority 32768 sys-id-ext 1)
             Address     ec30.918e.c100
             Hello Time   2 sec  Max Age 20 sec  Forward Delay 15 sec
             Aging Time 300

Interface        Role Sts Cost      Prio.Nbr Type
---------------- ---- --- --------- -------- --------------------------------
Po1              Desg FWD 12        128.56   P2p
After the ports are bundled, you can see that there are only 1 port recognized by STP. Another observation you can make is that the cost of the bundle port has decreased from 19 to 12. I also tested how STP will behave if I plugged out one of the port used by the channel-group.
Switch1#show etherchannel summary
Flags:  D - down        P - in port-channel
        I - stand-alone s - suspended
        H - Hot-standby (LACP only)
        R - Layer3      S - Layer2
        U - in use      f - failed to allocate aggregator
        u - unsuitable for bundling
        w - waiting to be aggregated
        d - default port


Number of channel-groups in use: 1
Number of aggregators:           1

Group  Port-channel  Protocol    Ports
------+-------------+-----------+-----------------------------------------------
1      Po1(SU)         LACP      Fa0/1(P)    Fa0/2(D)

Switch1#show spanning-tree

VLAN0001
  Spanning tree enabled protocol ieee
  Root ID    Priority    32769
             Address     ec30.918e.c100
             This bridge is the root
             Hello Time   2 sec  Max Age 20 sec  Forward Delay 15 sec

  Bridge ID  Priority    32769  (priority 32768 sys-id-ext 1)
             Address     ec30.918e.c100
             Hello Time   2 sec  Max Age 20 sec  Forward Delay 15 sec
             Aging Time 300

Interface        Role Sts Cost      Prio.Nbr Type
---------------- ---- --- --------- -------- --------------------------------
Po1              Desg FWD 19        128.56   P2p
Comparing before and after plugging one of the port on Switch1 shows that the cost has decreased but it is still recognized as a port-channel.
Redundant Links and STP by Ryo
Hi! Today, I tested STP with my two switches by simply connecting them with two cables. As shown below, one of the links belonging to the non-root bridge got blocked based on the priority number.
pi#show spanning-tree vlan 1

VLAN0001
  Spanning tree enabled protocol ieee
  Root ID    Priority    32769
             Address     ec30.918e.c100
             Cost        19
             Port        5 (FastEthernet0/3)
             Hello Time   2 sec  Max Age 20 sec  Forward Delay 15 sec

  Bridge ID  Priority    32769  (priority 32768 sys-id-ext 1)
             Address     f029.2952.8d80
             Hello Time   2 sec  Max Age 20 sec  Forward Delay 15 sec
             Aging Time  300 sec

Interface           Role Sts Cost      Prio.Nbr Type
------------------- ---- --- --------- -------- --------------------------------
Fa0/1               Desg FWD 19        128.3    P2p
Fa0/3               Root FWD 19        128.5    P2p
Fa0/5               Altn BLK 19        128.7    P2p
As the above shows, Fa0/3 is the root port connected to the switch on the other end. So I plugged it out to see if the connection remains up by changing the root port to Fa0/5. Below is the result.
pi>show spanning-tree vlan 1

VLAN0001
  Spanning tree enabled protocol ieee
  Root ID    Priority    32769
             Address     ec30.918e.c100
             Cost        19
             Port        7 (FastEthernet0/5)
             Hello Time   2 sec  Max Age 20 sec  Forward Delay 15 sec

  Bridge ID  Priority    32769  (priority 32768 sys-id-ext 1)
             Address     f029.2952.8d80
             Hello Time   2 sec  Max Age 20 sec  Forward Delay 15 sec
             Aging Time  15  sec

Interface           Role Sts Cost      Prio.Nbr Type
------------------- ---- --- --------- -------- --------------------------------
Fa0/1               Desg FWD 19        128.3    P2p
Fa0/5               Root LIS 19        128.7    P2p
As expected, Fa0/5 is now the root port and the connection is still up! However, one drawback of this configuration is that one of the links is left unused. In order to utilize both of the links, I can set up an etherchannel and bundle the two links. I'm currently studying etherchannel to actually test it out and see how it differs from simply connected redundant links🧐.
Inter VLAN Routing by Ryo
Hi! Today, I was working on Inter VLAN Routing using a router(800) and L2 switch(Catalyst 2960). I connected a PC to each VLAN(VLAN10, VLAN20) and tested if I can ping to each other. Below is the set up for the PCs(Windows, Raspberry Pi) connected to the switch. The ip address for the Windows PC is 192.168.1.2/24 and the gateway address for 192.168.2.0/24 is 192.168.1.1/24. For Raspberry Pi, its ip address is 192.168.2.2/24 and the gateway address for 192.168.1.0/24 is 192.168.2.1/24.
C:\WINDOWS\system32>route add 192.168.2.0 mask 255.255.255.0 192.168.1.1
OK!
┌──(kali㉿kali-raspberry-pi)-[~]
└─$ sudo ifconfig eth0 192.168.2.2
┌──(kali㉿kali-raspberry-pi)-[~]
└─$ sudo ip route add 192.168.1.0/255.255.255.0 via 192.168.2.1 dev eth0 onlink
┌──(kali㉿kali-raspberry-pi)-[~]
└─$ route -n
Kernel IP routing table
Destination     Gateway         Genmask         Flags Metric Ref    Use Iface
0.0.0.0         192.168.164.146 0.0.0.0         UG    600    0        0 wlan0
192.168.1.0     192.168.2.1     255.255.255.0   UG    0      0        0 eth0
192.168.2.0     192.168.2.1     255.255.255.0   UG    0      0        0 eth0
192.168.164.0   0.0.0.0         255.255.255.0   U     600    0        0 wlan0
Then I configured the switch. I prepared vlan10 & vlan20 for the Windows PC & Raspberry Pi, respectively. After finishing setting up vlans, you need to assign ports to the respective vlans. This time, I used 4 cables, two for connecting the PCs to the switch and the other two for connecting the router. Here are the commands I used for creating vlans.
Switch>enable
Switch#config terminal
Enter configuration commands, one per line.  End with CNTL/Z.
Switch(config)#vlan 10
Switch(config-vlan)#vlan 20
Switch(config-vlan)#do show vlan

VLAN Name                             Status    Ports
---- -------------------------------- --------- -------------------------------
1    default                          active    Fa0/1, Fa0/2, Fa0/3, Fa0/4
                                                Fa0/5, Fa0/6, Fa0/7, Fa0/8
                                                Fa0/9, Fa0/10, Fa0/11, Fa0/12
                                                Fa0/13, Fa0/14, Fa0/15, Fa0/16
                                                Fa0/17, Fa0/18, Fa0/19, Fa0/20
                                                Fa0/21, Fa0/22, Fa0/23, Fa0/24
                                                Gi0/1, Gi0/2
10   VLAN0010                         active
20   VLAN0020                         active
1002 fddi-default                     act/unsup
1003 token-ring-default               act/unsup
1004 fddinet-default                  act/unsup
1005 trnet-default                    act/unsup
Next I assigned the ports to the respective vlans.
Switch(config)#do show vlan

VLAN Name                             Status    Ports
---- -------------------------------- --------- -------------------------------
1    default                          active    Fa0/1, Fa0/2, Fa0/3, Fa0/4
                                                Fa0/5, Fa0/6, Fa0/7, Fa0/8
                                                Fa0/9, Fa0/10, Fa0/11, Fa0/12
                                                Fa0/13, Fa0/14, Fa0/15, Fa0/16
                                                Fa0/17, Fa0/18, Fa0/19, Fa0/20
                                                Fa0/21, Fa0/22, Fa0/23, Fa0/24
                                                Gi0/1, Gi0/2
10   VLAN0010                         active
20   VLAN0020                         active
1002 fddi-default                     act/unsup
1003 token-ring-default               act/unsup
1004 fddinet-default                  act/unsup
1005 trnet-default                    act/unsup

VLAN Type  SAID       MTU   Parent RingNo BridgeNo Stp  BrdgMode Trans1 Trans2
---- ----- ---------- ----- ------ ------ -------- ---- -------- ------ ------
1    enet  100001     1500  -      -      -        -    -        0      0
10   enet  100010     1500  -      -      -        -    -        0      0
20   enet  100020     1500  -      -      -        -    -        0      0
1002 fddi  101002     1500  -      -      -        -    -        0      0

Switch(config)#interface fa0/1
Switch(config-if)#
00:02:41: %CDP-4-NATIVE_VLAN_MISMATCH: Native VLAN mismatch discovered on FastEthernet0/3 (1), with Router FastEthernet0 (10).
Switch(config-if)#
00:02:47: %CDP-4-NATIVE_VLAN_MISMATCH: Native VLAN mismatch discovered on FastEthernet0/5 (1), with Router FastEthernet1 (20).
Switch(config-if)#switchport mode access
Switch(config-if)#switchport access vlan 10
Switch(config-if)#interface fa0/2
Switch(config-if)#switchport mode access
Switch(config-if)#switchport access vlan 20
Switch(config-if)#
00:03:36: %CDP-4-NATIVE_VLAN_MISMATCH: Native VLAN mismatch discovered on FastEthernet0/3 (1), with Router FastEthernet0 (10).
Switch(config-if)#interface fa0/3
Switch(config-if)#switchport access vlan 20
00:03:42: %CDP-4-NATIVE_VLAN_MISMATCH: Native VLAN mismatch discovered on FastEthernet0/5 (1), with Router FastEthernet1 (20).
Switch(config-if)#switchport mode access
Switch(config-if)#switchport access vlan 10
Switch(config-if)#interface fa0/5
Switch(config-if)#switchport mode access
Switch(config-if)#switchport access vlan 20
Switch(config-if)#switchport access vlan 20
00:04:10: %LINEPROTO-5-UPDOWN: Line protocol on Interface Vlan1, changed state tmode access
Switch(config-if)#do show vlan

VLAN Name                             Status    Ports
---- -------------------------------- --------- -------------------------------
1    default                          active    Fa0/4, Fa0/6, Fa0/7, Fa0/8
                                                Fa0/9, Fa0/10, Fa0/11, Fa0/12
                                                Fa0/13, Fa0/14, Fa0/15, Fa0/16
                                                Fa0/17, Fa0/18, Fa0/19, Fa0/20
                                                Fa0/21, Fa0/22, Fa0/23, Fa0/24
                                                Gi0/1, Gi0/2
10   VLAN0010                         active    Fa0/1, Fa0/3
20   VLAN0020                         active    Fa0/2, Fa0/5
1002 fddi-default                     act/unsup
1003 token-ring-default               act/unsup
1004 fddinet-default                  act/unsup
1005 trnet-default                    act/unsup

VLAN Type  SAID       MTU   Parent RingNo BridgeNo Stp  BrdgMode Trans1 Trans2
---- ----- ---------- ----- ------ ------ -------- ---- -------- ------ ------
1    enet  100001     1500  -      -      -        -    -        0      0
10   enet  100010     1500  -      -      -        -    -        0      0
20   enet  100020     1500  -      -      -        -    -        0      0
1002 fddi  101002     1500  -      -      -        -    -        0      0
1003 tr    101003     1500  -      -      -        -    -        0      0
After working on the switch, I had to configure the ports on the router each connected to the switch's vlan port. At first, I tried to assign IP address to the ports directly but I got this error.
Router#config terminal
Enter configuration commands, one per line.  End with CNTL/Z.
Router(config)#interface fastethernet0
Router(config-if)#ip address 192.168.1.1 255.255.255.0

% IP addresses may not be configured on L2 links.
The problem was that the port which I was configuring only works with L2 layer and an IP address can't be assigned. After doing some research, I figured out that I need to first create a vlan so that I can assign an IP address to it. The created vlan with an IP address can then be assigned to a port of your choice. Here is how I did it.
Router(config)#vlan 10
Router(config-vlan)#vlan 20
Router(config-vlan)#interface vlan 10
Router(config-if)#ip address 192.168.1.1 255.255.255.0
% 192.168.1.0 overlaps with Vlan1
Router(config-if)#interface vlan 1
Router(config-if)#ip address 192.168.3.1 255.255.255.0
Router(config-if)#interface vlan 10
Router(config-if)#ip address 192.168.1.1 255.255.255.0
Router(config-if)#no shut
Router(config-if)#interface vlan 20
Router(config-if)#
*Jan  3 09:40:49.434: %LINEPROTO-5-UPDOWN: Line protocol on Interface Vlan20, changed state to down
Router(config-if)#ip address 192.168.2.1 255.255.255.0
% 192.168.2.0 overlaps with Vlan2
Router(config-if)#interface vlan 2
Router(config-if)#ip address 192.168.4.1 255.255.255.0
Router(config-if)#interface vlan 20
Router(config-if)#ip address 192.168.2.1 255.255.255.0
Router(config-if)#no shut
Router(config-if)#interface fastethernet 1
Router(config-if)#switchport access vlan 10
Router(config-if)#interface fastethernet 2
Router(config-if)#switchport access vlan 20
Router(config-if)#exit
Router(config)#
Router(config)#do show interface (| include Vlan)
...
Vlan10 is up, line protocol is up
  Hardware is EtherSVI, address is e4d3.f166.3fd2 (bia e4d3.f166.3fd2)
  Internet address is 192.168.1.1/24
  MTU 1500 bytes, BW 100000 Kbit/sec, DLY 100 usec,
     reliability 255/255, txload 1/255, rxload 1/255
  ...
Vlan20 is up, line protocol is up
  Hardware is EtherSVI, address is e4d3.f166.3fd2 (bia e4d3.f166.3fd2)
  Internet address is 192.168.2.1/24
  MTU 1500 bytes, BW 100000 Kbit/sec, DLY 100 usec,
     reliability 255/255, txload 1/255, rxload 1/255
  ...
Below is the routing table after configuring the router.
Router>show ip route
Codes: L - local, C - connected, S - static, R - RIP, M - mobile, B - BGP
       D - EIGRP, EX - EIGRP external, O - OSPF, IA - OSPF inter area
       N1 - OSPF NSSA external type 1, N2 - OSPF NSSA external type 2
       E1 - OSPF external type 1, E2 - OSPF external type 2
       i - IS-IS, su - IS-IS summary, L1 - IS-IS level-1, L2 - IS-IS level-2
       ia - IS-IS inter area, * - candidate default, U - per-user static route
       o - ODR, P - periodic downloaded static route, H - NHRP, l - LISP
       + - replicated route, % - next hop override

Gateway of last resort is not set

      192.168.1.0/24 is variably subnetted, 2 subnets, 2 masks
C        192.168.1.0/24 is directly connected, Vlan10
L        192.168.1.1/32 is directly connected, Vlan10
      192.168.2.0/24 is variably subnetted, 2 subnets, 2 masks
C        192.168.2.0/24 is directly connected, Vlan20
L        192.168.2.1/32 is directly connected, Vlan20
Now we are ready to ping the PC on the other VLAN connected by the router! Here is the result pinging from the Windows PC(192.168.1.2/24) to Raspberry Pi(192.168.2.2/24)
C:\Users\Ryo>ping 192.168.2.2
Pinging 192.168.2.2 with 32 bytes of data:
Reply from 192.168.2.2: bytes=32 time=1ms TTL=63
Reply from 192.168.2.2: bytes=32 time=11ms TTL=63
Reply from 192.168.2.2: bytes=32 time=1ms TTL=63
Reply from 192.168.2.2: bytes=32 time=1ms TTL=63
Ping statistics for 192.168.2.2:
Packets: Sent = 4, Received = 4, Lost = 0 (0% loss),
Approximate round trip times in milli-seconds:
Minimum = 1ms, Maximum = 11ms, Average = 3ms
Configuring the router was somewhat difficult as the commands I found online for inter VLAN routing didn't work for the router(800). I had to do some researching to find the commands that works for the router but it was fun as you don't get to do this kind of researching when you are working on packet tracer😎.
Catalyst 2960 by Ryo
I recently bought a router and 2 switches(L2 and L3) for a studying purpose. Today I tried one of the switches, Catalyst 2960. I connected two of my PC and see if I can ping from one to the other. After connecting two of my PC to the ports Fa0/1-2, I checked if they are really connected.
Switch>show mac address-table
          Mac Address Table
-------------------------------------------

Vlan    Mac Address       Type        Ports
----    -----------       --------    -----
 All    0100.0ccc.cccc    STATIC      CPU
 All    0100.0ccc.cccd    STATIC      CPU
 All    0180.c200.0000    STATIC      CPU
 All    0180.c200.0001    STATIC      CPU
 All    0180.c200.0002    STATIC      CPU
 All    0180.c200.0003    STATIC      CPU
 All    0180.c200.0004    STATIC      CPU
 All    0180.c200.0005    STATIC      CPU
 All    0180.c200.0006    STATIC      CPU
 All    0180.c200.0007    STATIC      CPU
 All    0180.c200.0008    STATIC      CPU
 All    0180.c200.0009    STATIC      CPU
 All    0180.c200.000a    STATIC      CPU
 All    0180.c200.000b    STATIC      CPU
 All    0180.c200.000c    STATIC      CPU
 All    0180.c200.000d    STATIC      CPU
 All    0180.c200.000e    STATIC      CPU
 All    0180.c200.000f    STATIC      CPU
 All    0180.c200.0010    STATIC      CPU
 All    ffff.ffff.ffff    STATIC      CPU
   1    902e.169d.b2f1    DYNAMIC     Fa0/1
   1    e45f.01d3.5bd9    DYNAMIC     Fa0/2
Total Mac Addresses for this criterion: 22
You can see the mac address table has the mac address of the each device connected to the port(Fa0/1-2). However, I wasn't able to ping from my Windows PC(Fa0/1) to Raspberry-pi(Fa0/2). I checked the ARP table of my Windows PC and it showed the list with the mac address of raspberry pi.
C:\>arp -a
    Interface: 192.168.1.2 --- 0x11
    Internet Address      Physical Address      Type
    192.168.1.3           e4-5f-01-d3-5b-d9     dynamic
    192.168.1.255         ff-ff-ff-ff-ff-ff     static
The problem was my Windows PC's firewall😅. After configuring its firewall rules to allow ICMP traffic, I was able to ping!
C:\Users\Ryo>ping 192.168.1.3
Pinging 192.168.1.3 with 32 bytes of data:
Reply from 192.168.1.3: bytes=32 time=2ms TTL=64
Reply from 192.168.1.3: bytes=32 time=6ms TTL=64
Reply from 192.168.1.3: bytes=32 time=1ms TTL=64
Reply from 192.168.1.3: bytes=32 time<1ms TTL=64
Ping statistics for 192.168.1.3:
Packets: Sent = 4, Received = 4, Lost = 0 (0% loss),
Approximate round trip times in milli-seconds:
Minimum = 0ms, Maximum = 6ms, Average = 2ms
VLAN(vs subnet) by Ryo
I tried to understand the difference between VLAN and subnet by looking into their ARP broadcast request. First I deleted all the ARP entries on the source PC so that when I ping, there will be an ARP request broadcasted to all the devices connected to the switch. Here is how you can check and delete the ARP table.
C:\>arp -a
  Internet Address      Physical Address      Type
  192.168.2.4           0001.436a.8be5        dynamic
C:\>arp -d
C:\>arp -a
No ARP Entries Found
After deleting all the ARP entries, the source PC will send an ARP request as it has no mac address on its table. Here is the list of ports on the switch when an ARP request was sent. It shows an ARP reqeust is sent to all the ports except the one(FastEthernet0/3) which is connected to the source PC. In addition, even though FastEthernet0/1-2 are not within the same subnet(192.168.2.0/24), you can see that they still receive the ARP request sent by the source PC(192.168.2.2/24).
1. FastEthernet0/1 sends out the frame. #192.168.1.2
2. FastEthernet0/2 sends out the frame. #192.168.1.3
3. FastEthernet0/4 sends out the frame. #192.168.2.3
4. FastEthernet0/5 sends out the frame. #192.168.2.4
Now its time see how an ARP request will behave when the switch is divided into VLANs(192.168.1.0/24, 192.168.2.0/24) . I once again deleted all the ARP entries in the table of the source PC and here is the commands I used for creating VLANs.
Switch>enable
Switch#config terminal
Enter configuration commands, one per line.  End with CNTL/Z.
Switch(config)#int fa0/1
Switch(config-if)#exit
Switch(config)#vlan 10
Switch(config-vlan)#vlan 20
Switch(config-vlan)#int fa0/1
Switch(config-if)#switchport mode access
Switch(config-if)#switchport access vlan 10
Switch(config-if)#int fa0/2
Switch(config-if)#switchport mode access
Switch(config-if)#switchport access vlan 10
Switch(config-if)#int fa0/3
Switch(config-if)#switchport mode access
Switch(config-if)#switchport access vlan 20
Switch(config-if)#int fa0/4
Switch(config-if)#switchport mode access
Switch(config-if)#switchport access vlan 20
Switch(config-if)#int fa0/5
Switch(config-if)#switchport mode access
Switch(config-if)#switchport access vlan 20
Switch(config-if)#do show vlan

VLAN Name                             Status    Ports
---- -------------------------------- --------- -------------------------------
1    default                          active    Fa0/6, Fa0/7, Fa0/8, Fa0/9
                                                Fa0/10, Fa0/11, Fa0/12, Fa0/13
                                                Fa0/14, Fa0/15, Fa0/16, Fa0/17
                                                Fa0/18, Fa0/19, Fa0/20, Fa0/21
                                                Fa0/22, Fa0/23, Fa0/24, Gig0/1
                                                Gig0/2
10   vlan01                           active    Fa0/1, Fa0/2
20   vlan02                           active    Fa0/3, Fa0/4, Fa0/5
1002 fddi-default                     active
1003 token-ring-default               active
1004 fddinet-default                  active
1005 trnet-default                    active
I created VLAN01 and VLAN02 for 192.168.1.0/24 and 192.168.2.0/24, respectively. And here is the list of the ports that received an ARP request sent by the source PC(192.168.2.2/24). It shows that FastEthernet0/1-2 are not receiving an ARP request any more as they no longer belong to the same VLAN as the source PC(VLAN02)!
1. FastEthernet0/4 sends out the frame. #VLAN01
2. FastEthernet0/5 sends out the frame. #VLAN02
Once you are done with the VLANs, you can place the ports back to the default VLAN by the below commands.
Switch(config-if-range)#interface range Fa 0/1-5
Switch(config-if-range)#switchport access vlan 1
Switch(config-if-range)#do show vlan

VLAN Name                             Status    Ports
---- -------------------------------- --------- -------------------------------
1    default                          active    Fa0/1, Fa0/2, Fa0/3, Fa0/4
                                                Fa0/5, Fa0/6, Fa0/7, Fa0/8
                                                Fa0/9, Fa0/10, Fa0/11, Fa0/12
                                                Fa0/13, Fa0/14, Fa0/15, Fa0/16
                                                Fa0/17, Fa0/18, Fa0/19, Fa0/20
                                                Fa0/21, Fa0/22, Fa0/23, Fa0/24
                                                Gig0/1, Gig0/2
10   vlan01                           active
20   vlan02                           active
1002 fddi-default                     active
1003 token-ring-default               active
1004 fddinet-default                  active
1005 trnet-default                    active
Switch(config-if-range)#no vlan 10
Switch(config-if-range)#no vlan 20
How does a switch know how to route ping packets? by Ryo
After studying how different devices work at different layers, I got little confused how ping works if its only given ip address to reach the destination pc connected via switch which is a layer 2 device. Here's how it works.
1. We only have the destination's ip and no mac address info.
->ARP request which is broadcasted to all devices connected to the switch.
2. Once your PC has the mac address in its mac address table, the frame is sent to the switch which contains the mac address of the destination pc.
3. Switch needs to know which port is connected to the PC with the destination mac address.
->Flood the frame to all other ports if the destination mac address is not in the mac address table.
4. Once the switch gets the reply form the destination PC, it now knows which port to send the frame to get to the destination PC!
Here are ARP and Mac address tables before and after ping.
Switch#show mac address-table
          Mac Address Table
-------------------------------------------

Vlan    Mac Address       Type        Ports
----    -----------       --------    -----

Switch#show mac address-table
          Mac Address Table
-------------------------------------------

Vlan    Mac Address       Type        Ports
----    -----------       --------    -----

   1    00e0.8fe3.e0b3    DYNAMIC     Fa0/2
   1    00e0.f7a1.365d    DYNAMIC     Fa0/1

C:\>arp -a
No ARP Entries Found
C:\>arp -a
  Internet Address      Physical Address      Type
  192.168.1.2           00e0.8fe3.e0b3        dynamic
Setting up static routes by Ryo
For testing static routes, I created a system with 2 routers each connected to a PC. There are 3 networks so that one PC can connect to the other after setting up a static route.
Here I first configured router's interface for 192.168.1.0/24 and 192.168.1.1/24 is the default gateway for 192.168.1.0/24. I did the same for the other router responsible for 192.168.2.0/24. The third network(192.168.3.0/24) which needs to be configured is the one connecting the two routers.
Router>enable
Router#configure terminal
Enter configuration commands, one per line.  End with CNTL/Z.
Router(config)#interface GigabitEthernet 0/0/0
Router(config-if)#ip address 192.168.1.1 255.255.255.0
Router(config-if)#no shutdown

Router(config-if)#
%LINK-5-CHANGED: Interface GigabitEthernet0/0/0, changed state to up

%LINEPROTO-5-UPDOWN: Line protocol on Interface GigabitEthernet0/0/0, changed state to up

Router(config-if)#do show interfaces
GigabitEthernet0/0/0 is up, line protocol is up (connected)
  Hardware is ISR4331-3x1GE, address is 0001.4384.9c01 (bia 0001.4384.9c01)
  Internet address is 192.168.1.1/24
...
After setting up all three networks, I pinged form the PC with 192.168.1.2/24. But the result shows that it is still not reachable.
C:\>ping 192.168.2.2

Pinging 192.168.2.2 with 32 bytes of data:

Reply from 192.168.1.1: Destination host unreachable.
Reply from 192.168.1.1: Destination host unreachable.
Reply from 192.168.1.1: Destination host unreachable.
Reply from 192.168.1.1: Destination host unreachable.

Ping statistics for 192.168.2.2:
    Packets: Sent = 4, Received = 0, Lost = 4 (100% loss),
The remaining task is to set up the static routes so that the packet can reach the PC with 192.168.2.2/24. Here is how I set up the static route for 192.168.2.2/24.
Router(config)#ip route 192.168.2.0 255.255.255.0 192.168.3.2
After setting up as above, you still won't be able to get replies from the other end as the returning packets get lost at the 192.168.3.2/24.
C:\>ping 192.168.2.2

Pinging 192.168.2.2 with 32 bytes of data:

Request timed out.
Request timed out.
Request timed out.
Request timed out.

Ping statistics for 192.168.2.2:
    Packets: Sent = 4, Received = 0, Lost = 4 (100% loss),
Once I set up the static route as below, I was able to get replies from 192.168.2.2/24!
 Router(config)#ip route 192.168.1.0 255.255.255.0 192.168.3.1

C:\>ping 192.168.2.2

Pinging 192.168.2.2 with 32 bytes of data:

Reply from 192.168.2.2: bytes=32 time<1ms TTL=126
Reply from 192.168.2.2: bytes=32 time=10ms TTL=126
Reply from 192.168.2.2: bytes=32 time<1ms TTL=126
Reply from 192.168.2.2: bytes=32 time=11ms TTL=126

Ping statistics for 192.168.2.2:
    Packets: Sent = 4, Received = 4, Lost = 0 (0% loss),
Approximate round trip times in milli-seconds:
    Minimum = 0ms, Maximum = 11ms, Average = 5ms
Going hands-on by Ryo
I have been studying basic networking by reading books for CCNA. At this point, I think I should go hands-on with packet tracer or the router (Cisco 892) and switches (Cisco L2 and L3) I bought this week for studying purpose. Here are the list of the things I want to try hands-on. ・Static route ・OSPF ・ACL ・DHCP ・Unidirection & Bidirectional NAT ・NAPT(PAT) ・VLAN only using access ports (single switch) ・VLAN using access and trunk ports (two switches) ・VLAN rounting (using router and L2 switch, later using L3 switch)
Trying packet tracer by Ryo
I started using packet tracer and enjoying the tool a lot. I configured hub, switch, and router based network using the tool. It's really fun to put the materials you learned from books into practice! Here are the commands I used for configuring the router and the details of what it's doing.
Router>enable
Router#
Router#configure terminal
Enter configuration commands, one per line.  End with CNTL/Z.
Router(config)#interface GigabitEthernet0/0 #select the port(interface) on the router
Router(config-if)#ip address 192.168.1.4 255.255.255.0 #assign gateway IP address to the interface
Router(config-if)#no shutdown #bring up the inerface
Router(config-if)#
%LINK-5-CHANGED: Interface GigabitEthernet0/0, changed state to up
Here I tested if I am connected to the network configured above by pinging from a node within another network.
C:\>ping 192.168.1.3

Pinging 192.168.1.3 with 32 bytes of data:

Request timed out.
Reply from 192.168.1.3: bytes=32 time=14ms TTL=127
Reply from 192.168.1.3: bytes=32 time<1ms TTL=127
Reply from 192.168.1.3: bytes=32 time=11ms TTL=127

Ping statistics for 192.168.1.3:
    Packets: Sent = 4, Received = 3, Lost = 1 (25% loss),
Approximate round trip times in milli-seconds:
    Minimum = 0ms, Maximum = 14ms, Average = 8ms
It shows that the first packet is dropped. This is because of the switch on the network configured above does not have not have the destination pc's MAC address in its ARP table and need to get the one by 'flooding' which takes some time.
ARP by Ryo
"ip addr" shows the mac address for each interface, it's e4:5f:01:d3:5b:da in the case of wlan0. "arp" shows the router's mac address.
┌──(kali㉿kali-raspberry-pi)-[/var/lib/dhcp]
└─$ ip addr
...
3: wlan0:
The first hop of "traceroute", which is 192.168.164.146, shows the router's local ip address.
┌──(kali㉿kali-raspberry-pi)-[~]
└─$ traceroute 8.8.8.8
traceroute to 8.8.8.8 (8.8.8.8), 30 hops max, 60 byte packets
 1  192.168.164.146 (192.168.164.146)  40.242 ms  41.001 ms  43.085 ms
 2  121.83.171.60 (121.83.171.60)  74.412 ms  74.476 ms  76.689 ms
 3  100.64.3.181 (100.64.3.181)  81.472 ms  81.503 ms  83.573 ms
 4  58.191.128.178 (58.191.128.178)  86.298 ms  85.972 ms  86.346 ms
 5  61.205.127.233 (61.205.127.233)  86.192 ms  87.454 ms  87.482 ms
 6  203.140.81.209 (203.140.81.209)  86.012 ms  48.984 ms  55.241 ms
 7  60.56.20.190 (60.56.20.190)  54.917 ms  54.165 ms  62.331 ms
 8  142.250.172.36 (142.250.172.36)  62.152 ms  61.755 ms  65.046 ms
 9  * * *
10  dns.google (8.8.8.8)  65.708 ms  65.737 ms  65.926 ms
After piging to my laptop within the same local network, my laptop's mac address is added to the arp table. But ping is failing for some reason...
┌──(kali㉿kali-raspberry-pi)-[/var/lib/dhcp]
└─$ ping 192.168.164.137
PING 192.168.164.137 (192.168.164.137) 56(84) bytes of data.
^C
--- 192.168.164.137 ping statistics ---
7 packets transmitted, 0 received, 100% packet loss, time 6143ms
┌──(kali㉿kali-raspberry-pi)-[/var/lib/dhcp]
└─$ arp
Address                  HWtype  HWaddress           Flags Mask            Iface
192.168.164.146          ether   ac:a8:8e:ec:6e:66   C                     wlan0
192.168.164.137          ether   50:c2:e8:29:9b:cb   C                     wlan0
Wireshark shows the arp protocol is requesting the mac address of 192.168.164.137, and the response from the router shows the mac address is 50:c2:e8:29:9b:cb. However there is no response from 192.168.164.76.
2	18.664379309	Raspberr_d3:5b:da	Broadcast	ARP	42	Who has 192.168.164.137? Tell 192.168.164.76
3	18.680115301	CloudNet_29:9b:cb	Raspberr_d3:5b:da	ARP	42	192.168.164.137 is at 50:c2:e8:29:9b:cb
4	18.680196856	192.168.164.76	192.168.164.137	ICMP	98	Echo (ping) request  id=0x0002, seq=1/256, ttl=64 (no response found!)
I checked my laptop's firewall configuration and enable ping echo request. Ping is now working!
┌──(kali㉿kali-raspberry-pi)-[~]
└─$ ping 192.168.164.137
PING 192.168.164.137 (192.168.164.137) 56(84) bytes of data.
64 bytes from 192.168.164.137: icmp_seq=1 ttl=128 time=53.2 ms
64 bytes from 192.168.164.137: icmp_seq=2 ttl=128 time=75.9 ms
64 bytes from 192.168.164.137: icmp_seq=3 ttl=128 time=8.42 ms
64 bytes from 192.168.164.137: icmp_seq=4 ttl=128 time=42.1 ms
64 bytes from 192.168.164.137: icmp_seq=5 ttl=128 time=8.71 ms
^C
--- 192.168.164.137 ping statistics ---
5 packets transmitted, 5 received, 0% packet loss, time 4006ms
rtt min/avg/max/mdev = 8.417/37.644/75.852/26.122 ms
Compiling kernel 6 by Ryo
Here are the commands I used after finishing compiling the source code.
──(kali㉿kali-raspberry-pi)-[~/sources/linux]
└─$ ls
arch   certs    CREDITS  Documentation  fs       init      ipc     Kconfig  lib       MAINTAINERS  mm               modules.builtin.modinfo  modules.order   net     README.md  scripts   sound       tools  virt     vmlinux.o
block  COPYING  crypto   drivers        include  io_uring  Kbuild  kernel   LICENSES  Makefile     modules.builtin  modules-only.symvers     Module.symvers  README  samples    security  System.map  usr    vmlinux  vmlinux.symvers
┌──(kali㉿kali-raspberry-pi)-[~/sources/linux]
└─$ sudo make modules_install
┌──(kali㉿kali-raspberry-pi)-[~/sources/linux]
└─$ sudo cp arch/arm64/boot/dts/broadcom/*.dtb /boot/
┌──(kali㉿kali-raspberry-pi)-[~/sources/linux]
└─$ sudo cp arch/arm64/boot/dts/overlays/*.dtb* /boot/overlays/
┌──(kali㉿kali-raspberry-pi)-[~/sources/linux]
└─$ sudo cp arch/arm64/boot/dts/overlays/README /boot/overlays/
┌──(kali㉿kali-raspberry-pi)-[~/sources/linux]
└─$ sudo cp arch/arm64/boot/Image.gz /boot/kernel-ryo-1.img
┌──(kali㉿kali-raspberry-pi)-[/boot]
└─$ sudo vim config.txt
# 64-bit kernel for Raspberry Pi 4 is called kernel8l (armv8a)
kernel=kernel-ryo-1.img
┌──(kali㉿kali-raspberry-pi)-[/boot]
└─$ sudo reboot
And I got this!
┌──(kali㉿kali-raspberry-pi)-[/var/log]
└─$ uname -a
Linux kali-raspberry-pi 5.15.83-v8-ryos-first-kernel+ #1 SMP PREEMPT Fri Dec 16 12:25:46 UTC 2022 aarch64 GNU/Linux
┌──(kali㉿kali-raspberry-pi)-[/var/log]
└─$ cat messages
Dec 16 14:43:01 kali-raspberry-pi pulseaudio[968]: ICE I/O error handler called
Dec 16 14:43:04 kali-raspberry-pi kernel: [    0.000000] Hello World, I'm Ryo!
Dec 16 14:43:04 kali-raspberry-pi kernel: [    0.000000] Booting Linux on physical CPU 0x0000000000 [0x410fd083]
Dec 16 14:43:04 kali-raspberry-pi kernel: [    0.000000] Linux version 5.15.83-v8-ryos-first-kernel+ (kali@kali-raspberry-pi) (gcc (Debian 11.3.0-5) 11.3.0, GNU ld (GNU Binutils for Debian) 2.38.90.20220713) #1 SMP PREEMPT Fri Dec 16 12:25:46 UTC 2022
This time I was able to print during the boot up with my customized kernel! I can now try to do some work on the network stack and compile😁.
Compiling kernel 5 by Ryo
This time, I modified /arm/arm64/kernel/setup.c as below. You can find the source code here.
void __init smp_setup_processor_id(void)
{
    u64 mpidr = read_cpuid_mpidr() & MPIDR_HWID_BITMASK;
    set_cpu_logical_map(0, mpidr);

        pr_info("Hello World, its Ryo!");
    pr_info("Booting Linux on physical CPU 0x%010lx [0x%08x]\n",
        (unsigned long)mpidr, read_cpuid_id());
}
Here is the commands that I used.
$ KERNEL=kernel8
$ make bcm2711_defconfig
$ vim .config
CONFIG_LOCALVERSION="-v8-ryos-first-kernel"
$ make -j4 Image.gz modules dtbs
Compiling kernel 4 by Ryo
It's completed compiling! Here is what I did afterwards.
$ make
...
  OBJCOPY arch/arm64/boot/Image
  GZIP    arch/arm64/boot/Image.gz

[1]  + done       make
$ ls
arch   certs    CREDITS  Documentation  fs       init  Kbuild   kernel  LICENSES     Makefile  modules.builtin          modules-only.symvers  Module.symvers  README   scripts   sound       tools  virt     vmlinux.o
block  COPYING  crypto   drivers        include  ipc   Kconfig  lib     MAINTAINERS  mm        modules.builtin.modinfo  modules.order         net             samples  security  System.map  usr    vmlinux  vmlinux.symvers
$ file vmlinux
vmlinux: ELF 64-bit LSB pie executable, ARM aarch64, version 1 (SYSV), statically linked, BuildID[sha1]=8d74859bebe9cce14587e1b3272c7b11fe5de611, not stripped
$ sudo make modules_install
INSTALL /lib/modules/5.15.44-Re4son-v8l/kernel/sound/usb/misc/snd-ua101.ko
INSTALL /lib/modules/5.15.44-Re4son-v8l/kernel/sound/usb/snd-usb-audio.ko
INSTALL /lib/modules/5.15.44-Re4son-v8l/kernel/sound/usb/snd-usbmidi-lib.ko
DEPMOD  /lib/modules/5.15.44-Re4son-v8l
$ sudo make install
sh ./arch/arm64/boot/install.sh 5.15.44-Re4son-v8l \
arch/arm64/boot/Image System.map "/boot"
run-parts: executing /etc/kernel/postinst.d/initramfs-tools 5.15.44-Re4son-v8l /boot/vmlinuz-5.15.44-Re4son-v8l
update-initramfs: Generating /boot/initrd.img-5.15.44-Re4son-v8l
cryptsetup: ERROR: Couldn't resolve device /dev/root
cryptsetup: WARNING: Couldn't determine root device
I'm having trouble installing compiled files. I did some research and boot up process is not what I thought as Rasbarry Pi does not support grub😰. I found the kernel source code for Raspberry Pi here. Another mistake that I found is that I was working on linux/arch/arm. My Raspberry Pi is 64bits machine so the directory should be under linux/arch/arm64. Glad I found this mistake before compilation.
I will once again compile the source code and see how it goes😂.
Nmap SYN scanning by Ryo
Some stuff I learned about how Nmap SYN scanning works. Below is the captured packets from Wireshark.
10    13.006851    192.168.100.103    192.168.100.101    TCP    60    44276 → 445 [SYN] Seq=0 Win=1024 Len=0 MSS=1460
15    13.007423    192.168.100.101    192.168.100.103    TCP    60    445 → 44276 [SYN, ACK] Seq=0 Ack=1 Win=65535 Len=0 MSS=1460
16    13.007594    192.168.100.103    192.168.100.101    TCP    60    44276 → 445 [RST] Seq=1 Win=0 Len=0
It shows that the the state of port is open as the server's reply to the nmap's SYN is SYN,ACK. You can observe that SYN scan terminates 3 way handshake by RST sent by nmap. Also, here is the source code I found which I thought might be useful for spoofing Nmap OS detection. You can find the source code here. I think the below code is the part where it specifies the window size of a packet.
/* Numbers are taken from RFC3390.
 *
 * John Heffner states:
 *
 *    The RFC specifies a window of no more than 4380 bytes
 *    unless 2*MSS > 4380.  Reading the pseudocode in the RFC
 *    is a bit misleading because they use a clamp at 4380 bytes
 *    rather than use a multiplier in the relevant range.
 */
__u32 tcp_init_cwnd(struct tcp_sock *tp, struct dst_entry *dst)
{
    __u32 cwnd = (dst ? dst_metric(dst, RTAX_INITCWND) : 0);

    if (!cwnd) {
        if (tp->mss_cache > 1460)
            cwnd = 2;
        else
            cwnd = (tp->mss_cache > 1095) ? 3 : 4;
    }
    return min_t(__u32, cwnd, tp->snd_cwnd_clamp);
}
Compiling kernel 3 by Ryo
I modified ./arch/arm/kernel/setup.c as below. You can find the source code here.
void __init smp_setup_processor_id(void)
{
        int i;
        u32 mpidr = is_smp() ? read_cpuid_mpidr() & MPIDR_HWID_BITMASK : 0;
        u32 cpu = MPIDR_AFFINITY_LEVEL(mpidr, 0);

        cpu_logical_map(0) = cpu;
        for (i = 1; i < nr_cpu_ids; ++i)
                cpu_logical_map(i) = i == cpu ? 0 : i;

        /*
         * clear __my_cpu_offset on boot CPU to avoid hang caused by
         * using percpu variable early, for example, lockdep will
         * access percpu variable inside lock_release
         */
        set_my_cpu_offset(0);

        pr_info("Hello world, this is Ryo speaking!\n");
        pr_info("Booting Linux on physical CPU 0x%x\n", mpidr);
}
After the above modification, I started compiling the source code as below.
$ cp /boot/config-$(uname -r) .config
$ sudo apt-get install git fakeroot build-essential ncurses-dev xz-utils libssl-dev bc flex libelf-dev bison
$ make menuconfig
No change to .config

*** End of the configuration.
*** Execute 'make' to start the build or try 'make help'.
$ make
This is going to take a while😝.
Compiling kernel 2 by Ryo
I learned that you can't use printk() during the early stage of the boot up process😅. Here is the output of /var/log/messages.
┌──(kali㉿kali-raspberry-pi)-[/var/log]
└─$ cat messages
Dec 11 02:00:25 kali-raspberry-pi rsyslogd: [origin software="rsyslogd" swVersion="8.2206.0" x-pid="525" x-info="https://www.rsyslog.com"] rsyslogd was HUPed
Dec 11 02:27:19 kali-raspberry-pi kernel: [    0.000000] Booting Linux on physical CPU 0x0000000000 [0x410fd083]
Dec 11 02:27:19 kali-raspberry-pi kernel: [    0.000000] Linux version 5.15.44-Re4son-v8l+ (root@kali-raspberry-pi) (gcc (Debian 11.2.0-19) 11.2.0, GNU ld (GNU Binutils for Debian) 2.38) #1 SMP PREEMPT Debian kali-pi (2022-07-03)
Dec 11 02:27:19 kali-raspberry-pi kernel: [    0.000000] random: crng init done
Dec 11 02:27:19 kali-raspberry-pi kernel: [    0.000000] Machine model: Raspberry Pi 4 Model B Rev 1.5
I once again gone through the source code and found that "Booting Linux on" is printed by pr_info() and Linux version 5.15.44-Re4son-v8l+ is printed by decompressor_printk(). I will go for pr_info() as it comes earlier than decompressor_printk()😝.
┌──(kali㉿kali-raspberry-pi)-[~/sources/linux-5.15.44]
└─$ grep -r "Booting" .
./arch/arm/kernel/setup.c:      pr_info("Booting Linux on physical CPU 0x%x\n", mpidr);
┌──(kali㉿kali-raspberry-pi)-[~/sources/linux-5.15.44]
└─$ grep printk * -r | grep "decompressor_printk"
arch/s390/boot/pgm_check_info.c:        decompressor_printk("Linux version %s\n", kernel_version);
Compiling kernel by Ryo
I check my Raspberry Pi kernel version and its 5.15.44.
$ uname -r
5.15.44-Re4son-v8l+
I want to printk during the boot up process so I look through the kernel source code where "Booting Linux on..." is printed as shown below.
┌──(kali㉿kali-raspberry-pi)-[/var/log]
└─$ cat messages
Dec 11 02:00:25 kali-raspberry-pi rsyslogd: [origin software="rsyslogd" swVersion="8.2206.0" x-pid="525" x-info="https://www.rsyslog.com"] rsyslogd was HUPed
Dec 11 02:27:19 kali-raspberry-pi kernel: [    0.000000] Booting Linux on physical CPU 0x0000000000 [0x410fd083]
Dec 11 02:27:19 kali-raspberry-pi kernel: [    0.000000] Linux version 5.15.44-Re4son-v8l+ (root@kali-raspberry-pi) (gcc (Debian 11.2.0-19) 11.2.0, GNU ld (GNU Binutils for Debian) 2.38) #1 SMP PREEMPT Debian kali-pi (2022-07-03)
Dec 11 02:27:19 kali-raspberry-pi kernel: [    0.000000] random: crng init done
Dec 11 02:27:19 kali-raspberry-pi kernel: [    0.000000] Machine model: Raspberry Pi 4 Model B Rev 1.5
Seems like "Booting Linux on..." is printed by pr_info(), not printk(). Not yet sure where the first printk() is...
You can find the source code for version 5.15.44 here.
Inserting kernel modules by Ryo
Today I inserted a kernel module which simply prints "Hello Ryo!" under /var/log/messages. Here is the c program.
int init_module(void)
{
        //printk(KERN_INFO "Hello world 1.\n");
        printk(KERN_INFO "Hello Ryo!\n");
        return 0;
}
void cleanup_module(void)
{
        //printk(KERN_INFO "Goodbye world 1.\n");
        printk(KERN_INFO "Bye Ryo!\n");
}
MODULE_LICENSE("GPL");
initi_module() is used to initialize the module and cleanup_module is responsible for shutting down the module. When you are using printk(), you can give eight 8 levels of different logs at the part of "KERN_INFO". Below is the commands I used for initializing and removing the kernel.
make -C /lib/modules/`uname -r`/build/ M=${PWD} modules
sudo insmod hello_world.ko
sudo rmmod hello_world.ko
Here is the output of the above operation.
Dec 12 14:21:27 kali-raspberry-pi kernel: [ 8233.939103] Hello Ryo!
Dec 12 14:22:33 kali-raspberry-pi kernel: [ 8299.742310] Bye Ryo!
I will start looking into where I can printk() inside the kernel source code during the boot up process!
Kernel? by Ryo
I've been working on TUN device for a while and thought I should look into how packets are handled within the kernel. TUN device allows us to handle packets above layer 3. The corresponding entry point within the kernel is ip_rcv() whih can be found here. ip_local_deliver_finish() is the function whichis the exit of the layer 3 responsible for passing data to the layer 4 stack based on the protocol found in the ip header. You can find the function https://elixir.bootlin.com/linux/v2.6.20/source/net/ipv4/ip_input.c#L199. After ip_local_deliver_finish(), the data is sent to the function handling layer 4 protocol such as tcp_v4_rcv(), udp_rcv(), icmp_rcv(). Might be fun to customize your own network stack and make a kernel of your own😝.
Analyzing packets by Ryo
I am getting used to reading the hexs shown in Wireshark. Here is the summary of what is going with the below packet sent by my TUN program.
0x00, 0x00, 0x08, 0x00, 0x45, 0x00, 0x00, 0x54, 0x89, 0x4b, 0x40, 0x00, 0x40, 0x01, 0x39, 0x59, 0xcb, 0x00, 0x71, 0x02, 0xcb, 0x00, 0x71, 0x01, 0x08, 0x00, 0x2a, 0xc7, 0x00, 0x19, 0x00, 0x07, 0xc8, 0xb6, 0x8c, 0x63, 0x00, 0x00, 0x00, 0x00, 0xaf, 0x2b, 0x0a, 0x00, 0x00, 0x00, 0x00, 0x00, 0x10, 0x11, 0x12, 0x13, 0x14, 0x15, 0x16, 0x17, 0x18, 0x19, 0x1a, 0x1b, 0x1c, 0x1d, 0x1e, 0x1f, 0x20, 0x21, 0x22, 0x23, 0x24, 0x25, 0x26, 0x27, 0x28, 0x29, 0x2a, 0x2b, 0x2c, 0x2d, 0x2e, 0x2f, 0x30, 0x31, 0x32, 0x33, 0x34, 0x35, 0x36, 0x37
The first 4 bit (4 of 0x45)
・Version: the fist field tells us which IP version we are using, only IPv4 uses this header so you will always find decimal value 4 here.
The first 4 bit (5 of 0x45)
・The length of the ip header. In the case of this example, 5=>5*4(bytes)=>20(bytes)=>20 pair(0x45)s, as each hex is 4 bits.
・Because of the maximum possible value f=>15, the maximum ip header length is 15*4byte=60byte.
Protocol: 0x01
・1 stands for ICMP, 6 stands for tcp, 17 stands for UDP
Source and destination address: 0xcb, 0x00, 0x71, 0x02, 0xcb, 0x00, 0x71, 0x01
・In decimal, 203.0.113.2 and 203.0.113.1 respectively.
Sending packets with TUN device by Ryo
Below is the c program for sending receiving packets using TUN device. You should comment out either the dump_packet() or send_packet(). Otherwise, the program will be sending and receiving packets of its own.
void dump_packet(int fd, int count, char* buffer)
{
printf("the fd is %d. read %d bytes!\n", fd, count);
int i;
for (i=0; i
Wireshark shows the packet are exchanged as below. It's working!
1    0.000000000    203.0.113.2    203.0.113.1    ICMP    86    Echo (ping) request  id=0x0019, seq=7/1792, ttl=64 (reply in 2)
2    0.000082333    203.0.113.1    203.0.113.2    ICMP    84    Echo (ping) reply    id=0x0019, seq=7/1792, ttl=64 (request in 1)
Nmap OS spoofing? 2 by Ryo
Below is the database file which Nmap uses as a reference to packet info specific to OS. It is at /usr/share/nmap/nmap-os-db in the case of Ubuntu 20.04.4 LTS.
# Linux 2.6.30-ARCH #1 SMP PREEMPT Wed Sep 9 12:37:32 UTC 2009 i686 AMD Athlon(tm) XP 2000+ AuthenticAMD GNU/Linux
Fingerprint Linux 2.6.30
Class Linux | Linux | 2.6.X | general purpose
CPE cpe:/o:linux:linux_kernel:2.6.30
SEQ(SP=C1-CB%GCD=1-6%ISR=C5-CF%TI=Z%II=I%TS=U)
OPS(O1=M5B4NNSNW6%O2=M5B4NNSNW6%O3=M5B4NW6%O4=M5B4NNSNW6%O5=M5B4NNSNW6%O6=M5B4NNS)
WIN(W1=16D0%W2=16D0%W3=16D0%W4=16D0%W5=16D0%W6=16D0)
ECN(R=Y%DF=Y%T=3B-45%TG=40%W=16D0%O=M5B4NNSNW6%CC=N%Q=)
T1(R=Y%DF=Y%T=3B-45%TG=40%S=O%A=S+%F=AS%RD=0%Q=)
T2(R=N)
T3(R=Y%DF=Y%T=3B-45%TG=40%W=16D0%S=O%A=S+%F=AS%O=M5B4NNSNW6%RD=0%Q=)
T4(R=N)
T5(R=Y%DF=Y%T=3B-45%TG=40%W=0%S=Z%A=S+%F=AR%O=%RD=0%Q=)
T6(R=N)
T7(R=Y%DF=Y%T=3B-45%TG=40%W=0%S=Z%A=S+%F=AR%O=%RD=0%Q=)
U1(DF=N%T=3B-45%TG=40%IPL=164%UN=0%RIPL=G%RID=G%RIPCK=G%RUCK=G%RUD=G)
IE(DFI=N%T=3B-45%TG=40%CD=S)
The Nmap source code can be found here.
Nmap OS spoofing? by Ryo
I'm curious how Nmap OS detection works. Project like below is something that I am interested! https://nmap.org/misc/defeat-nmap-osdetect.html
Receiving packets using TUN devoce by Ryo
I added the below code to the previous post to receive ICMP packets.
char *buffer = (char *) calloc(150, sizeof(char));
ssize_t count = read(fd, buffer, 100);
Below is how read() can be used.
The read() function shall attempt to read nbyte bytes from the file associated with the open file descriptor, fildes, into the buffer pointed to by buf.
In the absence of errors, or if error detection is not performed, the read() function shall return zero and have no other results. reference
Below is the received packet in hex.
00 00 08 00 45 00 00 54 89 4b 40 00 40 01 39 59 cb 00 71 01 cb 00 71 02 08 00 2a c7 00 19 00 07 c8 b6 8c 63 00 00 00 00 af 2b 0a 00 00 00 00 00 10 11 12 13 14 15 16 17 18 19 1a 1b 1c 1d 1e 1f 20 21 22 23 24 25 26 27 28 29 2a 2b 2c 2d 2e 2f 30 31 32 33 34 35 36 37
The above shows that the source address is "cb 00 71 01->203.0.113.1" and the destination address is "cb 00 71 02->203.0.113.290". I'll try to send packets next time! I'm curious simply switching the source and destination address will be enough to send back the packet?
Creating TUN device by Ryo
I created a TUN interface with the below c program.
int main(int argc, char** argv)
{
  if (argc != 2)
    return 1;
  const char* device_name = argv[1];
  if (strlen(device_name) + 1 > IFNAMSIZ)
  {
    return 1;
  }
  int fd = open("/dev/net/tun", O_RDWR);
  if (fd == -1)
  {
    return 1;
  }
  struct ifreq ifr;
  memset(&ifr, 0, sizeof(ifr));
  ifr.ifr_flags = IFF_TUN;
  strncpy(ifr.ifr_name, device_name, IFNAMSIZ);
  int res = ioctl(fd, TUNSETIFF, &ifr);
  if (res == -1)
  {
    return 1;
  }
  printf("the created device is only available during this program\n");
  while (1) {
  }
  return 0;
}
The important part in the above code is below. You can provide the name of the interface to "ifr.ifr_name" and spcify whether you want the interface to be TUN or TAP with "ifr.ifr_flags".
int fd = open("/dev/net/tun", O_RDWR);
int res = ioctl(fd, TUNSETIFF, &ifr);
There is another way of creating TUN device using ip command which is shown below.
$ sudo ip tuntap add dev tun0 mode tun
My next attempt is to receive and read packets using read() and send(). I also want to see how packets are being exchanged using Wireshark.
TUN/TAP? by Ryo
Maybe TUN/TAP is a good place to start understanding how low-level networking works?
Device driver? by Ryo
You can check the file descriptor and associated device files with the below command.
$ lsof
cat     307              ryo    1w      REG   8, 32        0   106248 /home/ryo/ctf/kernel/file1.txt
Above shows that device files have major and minor numbers to identify the associated device drivers. You can see that 8, 32 are the major and minor number in the above case. You can check which device number has 8, 32 by the below command.
/dev$ ls -la
brw-------  1 root root   8,  32 Nov 23 11:51 sdc
Maybe I should start looking into device drivers used for networking?
Observing packets with Wireshark by Ryo
I used Wireshark to observe how packets are exchanged between client and server. Packets are sent by client form some random port. Packets are received by the server with the specified port by the running program.
Client socket program written in python
import socket
# AF_INET refers to ipv4
# SOCK_STREAM refers to TCP protocol
clientSocket = socket.socket(socket.AF_INET, socket.SOCK_STREAM)
# 3 way handshake(SYN) as socket.SOCK_STREAM is the selected type
# clientSocket.connect(('127.0.0.1', 12345))
clientSocket.connect(('192.168.50.130', 1234))
dataFromServer = clientSocket.recv(1024)
print(dataFromServer.decode())
Server socket program written in python
import socket
s = socket.socket()
port = 12345
s.bind(('', port))
s.listen(5)
while True:
    # 3 way handshake(ACK) as socket.SOCK_STREAM is the selected type
    clientSocket, addr = s.accept()
    print(addr)
    clientSocket.send('Thank you for connecting'.encode())
    clientSocket.close()
    break
Packets form Wireshark
1	0.000000000	127.0.0.1	127.0.0.1	TCP	74	44070 → 1234 [SYN] Seq=0 Win=65495 Len=0 MSS=65495 SACK_PERM=1 TSval=4210716831 TSecr=0 WS=128
2	0.000113299	127.0.0.1	127.0.0.1	TCP	74	1234 → 44070 [SYN, ACK] Seq=0 Ack=1 Win=65483 Len=0 MSS=65495 SACK_PERM=1 TSval=4210716831 TSecr=4210716831 WS=128
Socket Basics by Ryo
Some stuff I learned about socket programming ・client socket socket.socket, socket.connect ・server socket socket.connect, socket.bind, socket.listen, socket.accept Client socket sends SYN with socket.connect and server socket sends ACK with socket.accept. Server socket create client-like(temporary) socket for every incoming client socket.